U.S. Census Bureau estimates just one-third of Hoosier counties are growing, but state overall is adding residents
The U.S. Census Bureau released its latest population estimates toward the end of last week, with figures for July 2018 broken down by state and county. Indiana as a state is estimated to be growing, but just 33 of the state’s 92 counties show estimated growth.
Indiana Compared to U.S.
Indiana is estimated to have added 31,796 more residents (about a half a percent more) from 2017 to 2018, bringing its estimated total to 6,691,878 Hoosiers.
Since the last actual count was taken in 2010, Indiana is estimated to have increased its population by 3.2 percent. For that period, on a list that includes the 50 states, Puerto Rico and Washington, D.C.—for a total of 52—Indiana’s estimated growth ranks percentage-wise 30th.
Here’s the first 10 spots on that list:
Top 10 States for Estimated Population Growth from 2010 to 2018
| State | 2018 Estimate |
Percent Increase from 2010
|
| District of Columbia | 702,455 | 16.74% |
| Utah | 3,161,105 | 14.37% |
| Texas | 28,701,845 | 14.14% |
| Florida | 21,299,325 | 13.29% |
| Colorado | 5,695,564 | 13.25% |
| North Dakota | 760,077 | 13.01% |
| Nevada | 3,034,392 | 12.36% |
| Arizona | 7,171,646 | 12.20% |
| Washington | 7,535,591 | 12.06% |
| Idaho | 1,754,208 | 11.91% |
Compared to its geographic neighbors, Indiana’s 3.2 percent is a smidgen greater than Kentucky’s 3 percent, and greater than twice Ohio’s 1.3 percent or Michigan’s
1.1 percent. Illinois is estimated to have lost 0.7 percent of its population over the last eight years. It’s one of three states on the list estimated to have lost population during that time.
Puerto Rico ranks at the bottom with an estimated loss of 14.2 percent, putting its 2018 estimated population total at 3,195,153. That’s still more than 21 states on the list.
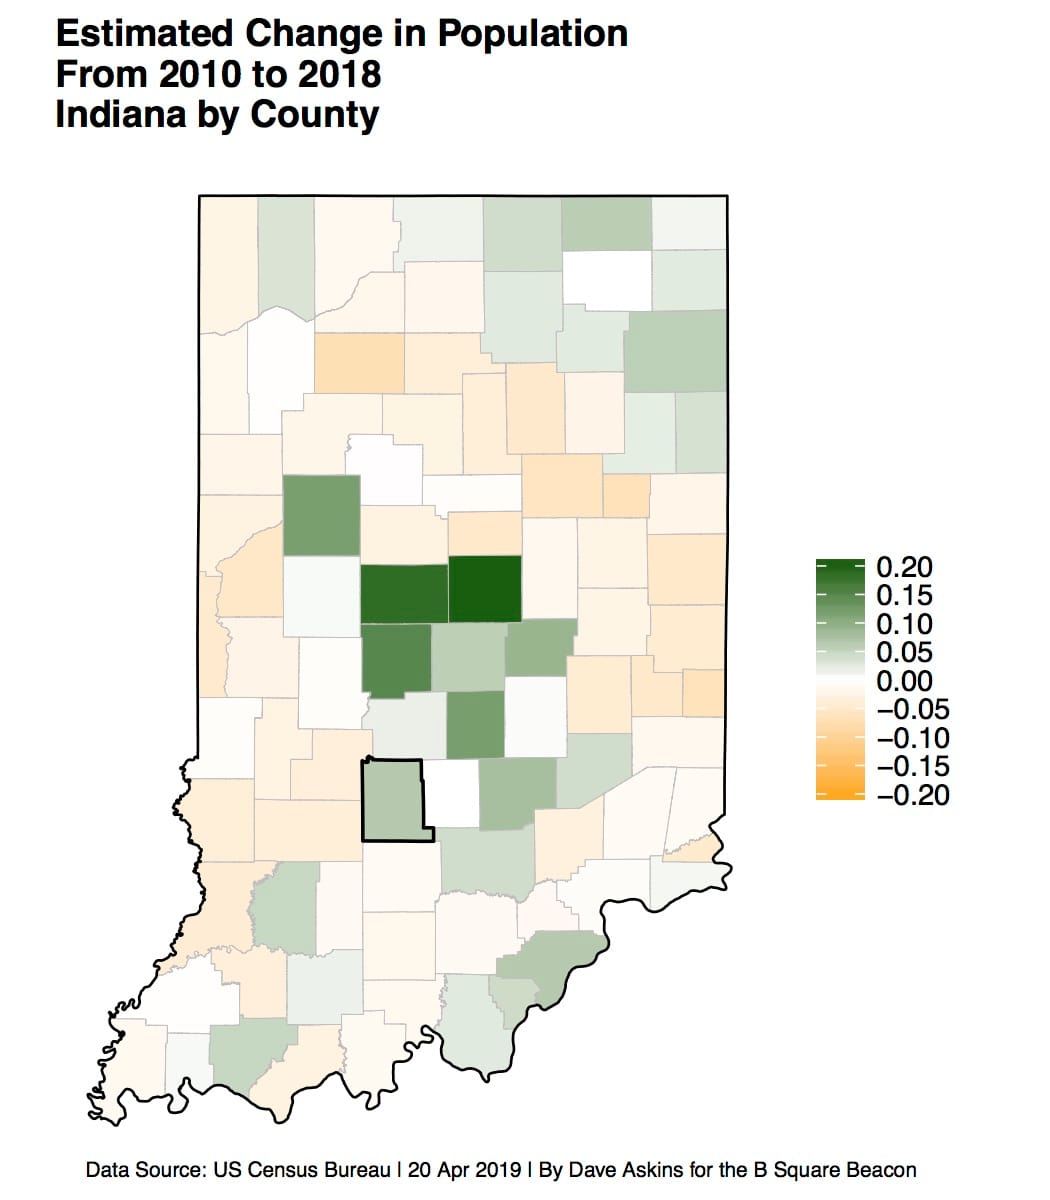
Indiana by County
The 33 Indiana counties estimated to be growing show some discernible geographic patterns.
One cluster of growing counties is centered around Marion County (Indianapolis): Boone, Hamilton, Hendricks, Hancock, Morgan, Johnson, Monroe, Bartholomew, Jackson and Decatur. It’s not clear if Tippecanoe County, home to Purdue University and northeast of that clump, should count as the same growth cluster.
Another area of growth is the northeast corner of the state, including these counties: St. Joseph, Elkhart, Lagrange, Steuben, Kosciusko, Whitley, Allen, De Kalb, Wells, and Adams.
A three-county area across the Ohio River from Louisville—Harrison, Floyd and Clark counties—is also estimated to be growing.

Components of Growth/Decline
The U.S. Census Bureau uses two components to estimate population change. One is the difference between the estimated number of births and deaths in an area, called “natural increase” by the bureau. The second is an estimate of the number of people moving to and away from a place—that is, “migration.”
Migration is broken down by domestic and international migration. The category of international migration includes more than just foreign-born residents who move to a place. From the footnote in the bureau’s report: “Specifically, it includes: (a) the net international migration of the foreign born, (b) the net migration between the United States and Puerto Rico, (c) the net migration of natives to and from the United States, and (d) the net movement of the Armed Forces population between the United States and overseas. Net international migration for Puerto Rico includes the migration of native and foreign-born populations between the United States and Puerto Rico.”
Fifteen Indiana counties have estimated negative net migration from 2010 to 2018 and still show estimated growth, because the “natural increase”—the difference between births and deaths—compensates for it. An example is Marion County, which is estimated to have lost 26,197 residents to domestic migration, and added 24,295 due to international migration for a net loss of 1,902 residents due to migration. But the natural increase for Marion County from 2010 to 2018 was 53,802, which made for an estimated total increase of residents.
Thirty-five Indiana counties have estimated population decline, because the natural increase doesn’t compensate for the negative net migration. An example is Lake County, which shows a net migration of -21,166 and a natural increase of 9,485, leaving an estimated total population decline.
Twenty-four Indiana counties are estimated to have experienced a natural decrease (more deaths than births) between 2010 and 2018.
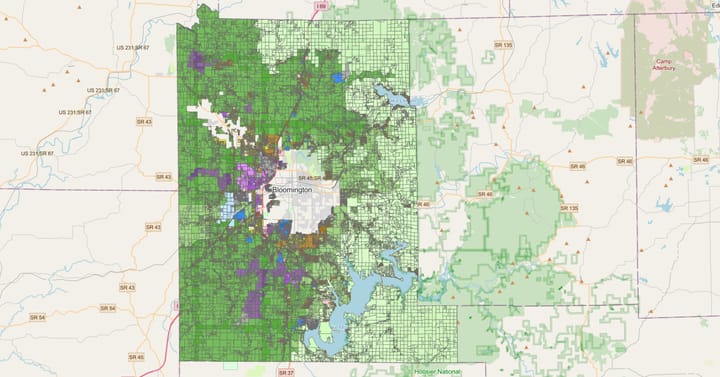
Monroe County is one of nine Indiana counties with more than half its growth that can be attributed to international migration. From 2010 to 2018, Monroe County is estimated to have lost 1,686 residents through domestic migration but gained 7,429 through international migration. Natural increase (more births and deaths) brought the estimated increase to 8,958 residents. The other eight counties fitting that description are Tippecanoe, Bartholomew, Dubois, St. Joseph, Switzerland, Vanderburgh, Montgomery and Shelby.
Monroe County is like most other Indiana counties in that its estimated domestic migration is negative between 2010 and 2018. Just 15 counties in Indiana showed estimated positive domestic migration. That is, for all but 15 counties in Indiana, more people moved from there to some other place than vice versa.
The 15 counties with positive domestic migration include at least one clear geographic pattern: They surround but don’t include Marion County (Indianapolis).

[Link to U. S. Census Bureau page of links to various tables]


Comments ()