Higher rates for Bloomington sewer customers: An inside-and-out story

How much sewage do Bloomington utilities customers generate every year? About 2.57 billion gallons. Lake Monroe’s capacity of about 77.14 billion gallons could hold roughly 30 years worth of Bloomington’s sewage.
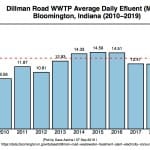
Bloomington’s sewage is not piped into Lake Monroe, of course. It goes to one of two wastewater treatment plants—Blucher Poole or Dillman Road. These days the Dillman Road facility often operates near or even over its rated capacity of 15 million gallons a day.
It’s a situation that caught the attention of the Indiana Department of Environmental Management (IDEM) recently, in 2016, and two decades ago, in 1999. IDEM sent “early warning” letters to Bloomington noting that the average daily flow through the plant, measured over the course of a year or more, was approaching or over 90 percent of the rated capacity of the facility.
So Bloomington’s utilities director, Vic Kelson, will be appearing in front of the city council on Wednesday (Sept. 11), to lay out the case for a sewer rate increase, to help pay for needed improvements to the city’s two wastewater treatment facilities.
The department’s capital improvement plan over the next seven years calls for about $35 million worth of improvements to Dillman Road and $17 million for the Blucher Poole facility.
The proposed rate increase works out to 72 cents more per month—for an average customer inside the city limits. For an average customer outside the city, the 15-percent increase works out to $3.60 more per month.
It’s the first time that City of Bloomington Utilities (CBU) will be treating customers inside and outside the city as separate classes of customers. It’s a possibility recognized in state law, and is based on a higher cost of the sewage collection for customers outside the city limits. The cost of treating sewage is the same, no matter where it comes from. But per customer it’s more cost efficient to collect sewage from areas with higher population density.
As members of the Bloomington Utilities Service Board drew out, during their Sept. 3 meeting, a differential cost of service exists even inside the city limits. And if customers currently outside the city were annexed into the city, their cost of service would not change, but the inside-city rates would be adjusted so that recently annexed customers would match those of other customers inside the city.
Kelson got approval for the rate increase from Bloomington Utilities Service Board (USB) at the Sept. 3 meeting. The city council’s Wednesday session is for its committee of the whole, so there won’t be a vote on the rate increase—it’s a way for councilmembers to focus on a topic and learn about it in detail, before their vote on Sept. 18.
The council got a first reading of the rate increase, along with some sewage bond re-funding items, at its Sept. 4 meeting.
Frequency of increases: Every two years
The proposed sewer rate increase this year follows a 22 percent increase that was implemented at the start of 2017.
Utilities director Vic Kelson told the Utilities Service Board on Sept. 3 that the city council had indicated it wanted a regular schedule of rate incremental increases, to reduce the shock of less frequent but more substantial increases. So the department had opted to adopt a schedule of water rate increases in presidential election years, with stormwater and sewer rate increases done in mid-term election years.
The 2018 stormwater increase was consistent with that schedule. The sewer rate increase is being proposed now instead of last year, Kelson said, because the analysis was not done in time.
At the board meeting, the city council’s representative to the USB, Jim Sims, said he wanted to emphasize that while rate increases were on an every-four-year schedule for any specific rate, customers could expect rate increases of some kind every two years.
Inside versus outside: Calculation
Craig Lotz, who’s with Crowe LLP, the consultant that did the cost-of-service analysis, walked the USB through the calculations, which yielded an outside-the-city surcharge of 12 percent.
The calculations started with 1,676,377 cubic feet of pipe in the entire collection system. Of that total, 1,479,067 cubic feet (88.23 percent) is common to all customers. But 197,310 cubic feet (11.77 percent) is used only by outside customers.
The 11.77 percent of the collection system was multiplied by $3,491,329 in total collection system expenses to get the collection system expenses that are caused by outside customers: $410,929
To get a base cost for all customers, Lotz subtracted $410,929 of expenses attributable to outside customers to get a total cost of $20,473,777. Dividing that number by 2.57 billion gallons of sewage gives $7.97 per 1,000 gallons of sewage as the base charge for customers both inside and outside of the city.
Lotz then took the expenses caused by outside customers ($410,929) and divided by the annual consumption of outside users (432,184,000 gallons) to get $0.95 per 1,000 gallons of sewage.
So the cost for an outside user is the base cost ($7.97 plus the outside user portion ($0.95) or $8.92 per 1000 gallons. That’s 12 percent more than an inside user. So 12 percent is the surcharge for outside users evident in the proposed rate increases.
Proposed rates were set based on projections for the revenue needs of the sewage works, which include tens of millions of dollars for capital improvements to the wastewater treatment plants. Utilities director Vic Kelson told the USB that about half the rate increase was driven by those capital improvement needs, and the other half was due to ordinary inflationary increases.
The 12-percent outside-the-city surcharge is reflected in both the usage charge and the monthly service charge.
Usage Charge (per 1,000 gallons)
| Current | Proposed | |
| Inside City Customers | $7.76 | $7.99 |
| Outside City Customers | $7.76 | $8.95 |
Monthly Service Charge
| Current | Proposed | |
| Inside City Customers | $7.95 | $8.19 |
| Outside City Customers | $7.95 | $9.17 |
The following charts show some typical customer bills based on the monthly service charge and the usage rates.
An average inside-the-city customer uses 3,300 gallons of sewage service a month. Outside the city, an average customer uses 3,700 gallons of service.
Inside the City
| Gallons | Current | Proposed | Difference |
| – | $7.95 | $8.19 | $0.24 |
| 3,000 | $31.23 | $32.16 | $0.93 |
| 5,000 | $46.75 | $48.14 | $1.39 |
| 7,000 | $62.27 | $64.12 | $1.85 |
Outside the City
| Gallons | Current | Proposed | Difference |
| – | $7.95 | $9.17 | $1.22 |
| 3,000 | $31.23 | $36.02 | $4.79 |
| 5,000 | $46.75 | $53.92 | $7.17 |
| 7,000 | $62.67 | $71.82 | $9.55 |
Inside versus outside: State law
The state statute on municipal sewage works recognizes the ability of a city to impose different rates on customers based on their location inside or outside the city boundary.
Once the distinction is made between classes of customers, the fees that are charged are supposed to be based on differences in costs or the number of users:
…The municipal legislative body may exercise reasonable discretion in adopting different schedules of fees, or making classifications in schedules of fees, based on variations in:
(1) the costs, including capital expenditures, of furnishing services to various classes of users or to various locations; or
(2) the number of users in various locations.
Utilities director Vic Kelson told the USB on Sept. 3 that the customer class distinction is based on the differential cost of providing collection service. It’s also based on the idea that the actual construction of the original facilities was funded by city customers and the fact that city customers, as property tax payers, are responsible for backing any debt incurred by CBU.
At the USB meeting, Jim Sims, who’s the city council ex officio, non-voting appointee to the USB, and Jean Capler, who’s a mayoral appointee, asked some questions focused on the inside-outside issue.
Their comments drew out the fact that even inside the city, cost-of-service differentials exist between customers. That’s because residential density is not uniform throughout the city. But CBU isn’t proposing to establish different rate classes among city customers, in part because there’s not legislation that would support it, Kelson said.
As Capler put it, “Customers that might be brought into the city, may now be considered inside-city customers—their density may be a little less than other parts of the city. [The density of the area where they live] might not change immediately by being in the city, but it adds in to the average cost for inside-the-city customers.”
When Sims talked about the issue earlier, he had made a point of not using the word “annexation,” opting for the phrase “bring into the city,” and Capler followed suit.
Not a subject of discussion at the USB meeting was the way sewer works usage is measured. There’s not a meter on sewer pipes. Instead, usage by a customer of the sewer pipes is deduced from water usage.
Not all water used by a customer goes down a drain or is flushed down a toilet, especially by customers who water their lawns in the summer. So the city code on rates for sewage service carves out four months of the year, which are not based on actual drinking water usage.
For June, July, August, and September, sewer rates are based on an average of the water used in April and May, or actual usage, whichever is less. From the city code:
10.08.030 – Rates—Based on quantity of water used.
a) Residential summer rates for billings issued during the months of June, July, August, and September shall be based upon the average metered water consumption for billings issued during the months of April and May or actual usage, whichever is less. In order to more accurately reflect the actual wastewater usage of these customers, the utilities service board may, by the adoption of a resolution, change the months used to set the summer rates and the length of time the summer rates are in effect. All other users shall be charged on the basis of one hundred percent of metered water consumption subject to user proof of lower wastewater use.
The capacity issues at the Dillman Road wastewater treatment plant that are driving much of the sewer rate increase that’s being proposed now have been an issue for several years. At the Sept. 3 meeting of the USB, utilities director Vic Kelson, who took the position in April of 2016, told board members that just a few months after the last sewer rate increase was approved, Bloomington had received an “early warning” letter from Indiana Department of Environmental Management (IDEM) about the Dillman Road plant.
The letter, dated Oct. 20, 2016, describes the situation as a “chronic hydraulic overload condition” and notes that “the annual average rates of discharge for [2014 and 2015] were 95 percent and 94 percent respectively, based on the design flow of 15 MGD [million gallons a day].” There’s a 90-percent threshold for the IDEM to notify a municipality that new connections to the sewer might need to be banned, according to the letter.
The 2016 letter leads off with a reference to a similar letter sent a decade and a half earlier, in 1999. The older letter notes that in 1998 the Dillman Road facility had an average loading of 13.21 million gallons a day, or 88 percent of its 15 MGD rating.
(IDEM correspondence to municipalities is available through its online file cabinet.)
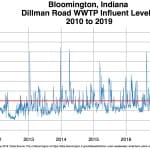
The concerns expressed by IDEM in the more recent letter, about 2014 and 2015 loads at Dillman Road, are confirmed by numbers available from Bloomington’s B Clear data portal. Those numbers also show that by 2017 and 2018 the average daily loads at Dillman had dropped below the 90-percent threshold.

According to CBU public affairs specialist Holly McLauchlin, the department’s sewer lining program has helped reduced the flow into Dillman for 2017 and 2018. That’s because lining sewer pipes eliminates cracks in pipes, through which rain water can get into the sanitary sewer system. It’s called “Inflow and Infiltration” or I&I for short.
Even though Bloomington has separate stormwater and wastewater systems, the effect of I&I means that there’s a strong correlation between heavy rains and sanitary sewer overflows out of manholes. An extraordinarily wet spring could account for the average daily loads at Dillman climbing again, at least through August of this year, after the drops in 2017 and 2018.
But based on trends since 2010, the flows at Dillman in the first eight months of the year have generally been higher than for the whole year—on average a half million gallons per day more. That includes a couple years that were weather-wise relatively dry, like 2012. That means by the end of 2019, the average daily total is likely to be less than the 14.06 MGD through the end of August.
The capital improvements planned for the Dillman Road plant are supposed to bring the rating up to 20 MGD, Kelson told the USB at its Sept. 3 meeting, and that’s projected to be adequate for the next 20 years, based on projected growth in the city.
The city’s data shows several days when the flow through Dillman Road’s plant has exceeded its most recent rating of 15 MGD.

About those days when Dillman Road has gone over 15 MG, McLauchlin said:
1. The 15MGD is a rating from IDEM based on conditions at that time. We have since made process improvements but have not been re-rated by IDEM.
2. There is an EQ [equalization] basin at Dillman. It can hold water until the plant is ready to treat it.
3. Heavy rain will cause more flow, but it also dilutes the water making it easier and faster to treat.
Sanitary sewer overflows
The IDEM early warning letter in 2016 notes that the larger volumes at Dillman did not include the amounts of sewage that did not go through Dillman because they escaped the system though overflows.
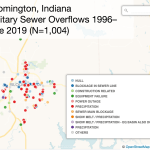
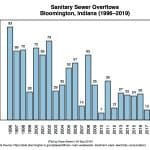
The city tracks sanitary sewer overflow incidents. Based on numbers through mid-June, the city appears to be on a pace for sanitary sewer overflows that would make 2019 the biggest year for overflows in about a decade. But three-quarters of those overflows—27 out of 36–came during a two-day period of heavy rains on Feb. 6 and Feb. 7.

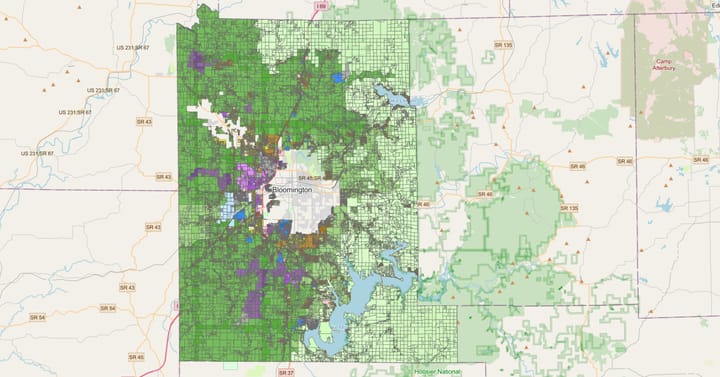
Bloomington’s data set on sanitary sewer overflows includes latitude and longitude data, which makes it possible to see where they happened. In this interactive map built by The Beacon, clicking on a location reveals additional information, like the date of the overflow.

Comments ()