Bloomington climate trends could mean wetter summers, higher lake levels

Three decades from now, Indiana is forecast to see between 6 and 8 percent more rainfall than it averaged in the past, depending on the amount of greenhouse gas emissions during the lead-up to mid-century.
That’s according to a 2018 report from the Purdue Climate Change Research Center.
According to the report, in southern Indiana, the increased precipitation is predicted to come more in the winter and spring months.
But based on records of precipitation and the water levels at Lake Monroe in the past two and a half decades, southern Indiana looks like it could be seeing more rain in the first half of summer.
Earlier this week, the Indianapolis office of the National Weather Service tweeted out a link to a report on the anomaly of this summer’s first half: It has been way wetter than normal.
The abnormal amount of region-wide rainfall has caused high water on Lake Monroe. Last week Indiana’s Department of Natural Resources closed the swim beaches at the lake’s Fairfax SRA and Paynetown SRA and they’ve stayed closed.
Rainfall and lake levels are related, of course. And over the last quarter century, both seem to be showing an upward trend for this time of year.
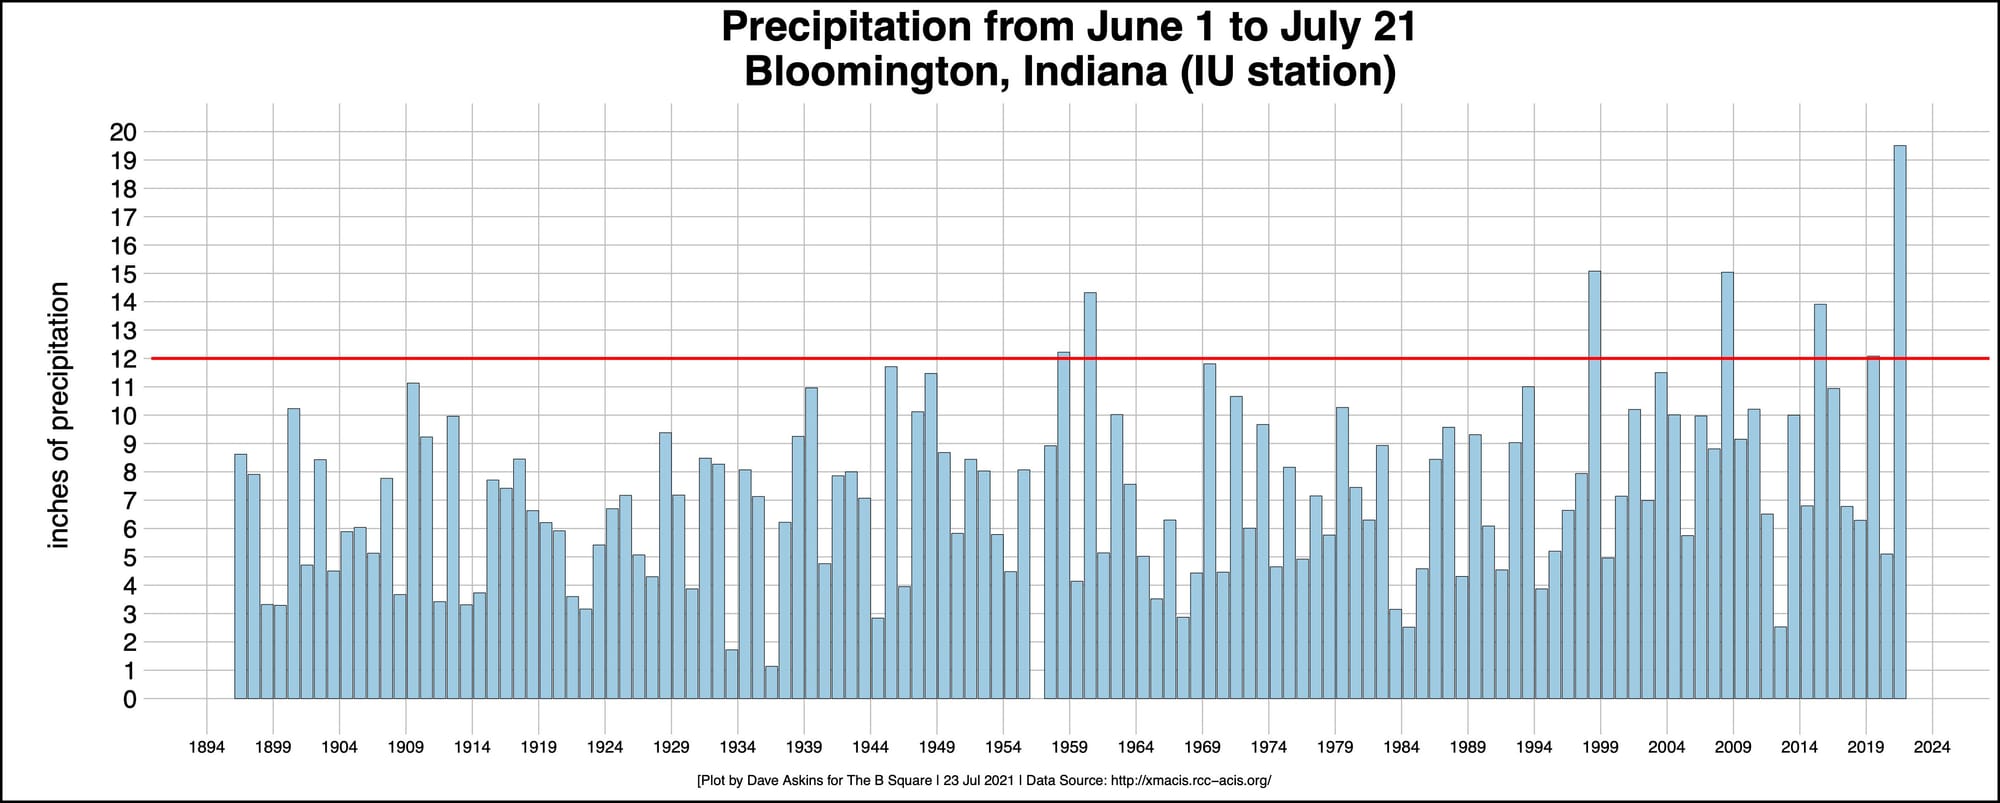
The tweet from the NWS included a specific mention of Bloomington: The 16.91 inches of rain that Bloomington saw from June 1 through July 17 this year was a 126-year-old record.
Those kinds of numbers can be sourced by using the “Seasonal Time Series” options in the NOAA Regional Climate Centers online data interface.
Including the days since the NWS tweet adds another 2.5 inches to Bloomington’s total, which brings it close to 20 inches. That’s way ahead of second place for the same period, which is basically a dead heat at 15 inches between 1998 and 2008 .
Based on NOAA records, in the last 25 years, for the period between June 1 through July 21, the rainfall at Bloomington’s Indiana University rain gauge has been measured at more than a foot for five years: 1998, 2008, 2015, 2019, 2021. In the 100 years before that, the amount of precipitation for the 7-week period reached over a foot for just two years: 1958 and 1960.
Since 1996, the average rainfall for the early summer period has averaged about 9.25 inches. That’s about 37 percent more than the 6.75 inches per year that the early summer period averaged for the century before that.
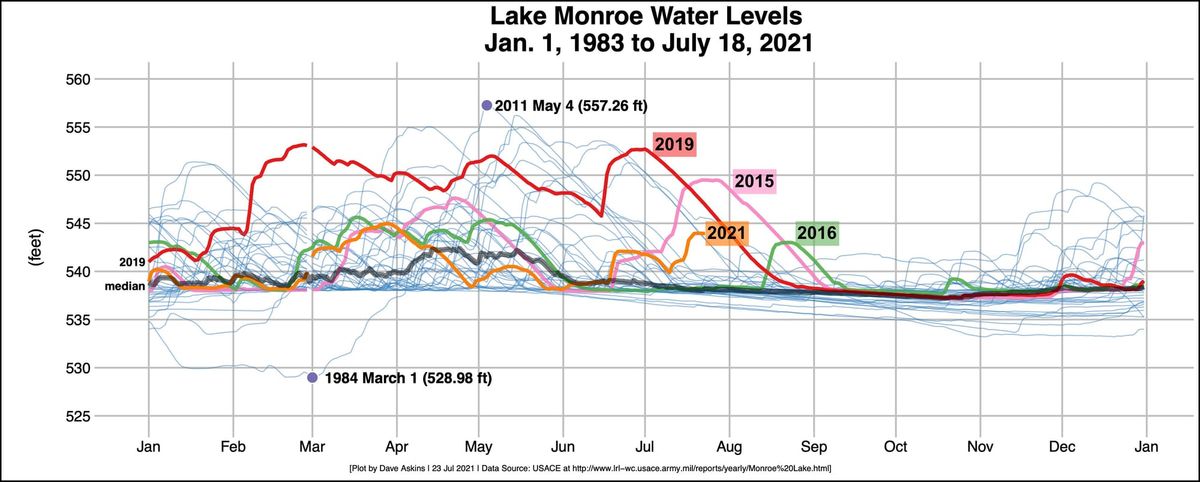
Lake Monroe’s current level of 544 feet above sea level is well below the all-time record of 557.26 on May 4, 2011. But 544 feet is 5.75 feet higher than the median height for this time of year, based on records dating back to 1983.
For this time of year, the current lake level ranks as the fourth highest since 1983. Two of the years when the water level in the third week of July was higher than now came in the last six years: 2015 and 2019.
Gabriel Filippelli, a professor of earth sciences at IUPUI who studies climate change, responded to an emailed question about whether the higher Lake Monroe levels this time of year could be a new pattern. He wrote: “Because there are only a few years reflected in this pattern, I would hesitate to say it is the new normal.”
Filippelli added, “But it is not at all unreasonable to note this recent pattern, and look toward other weather trends, like enhanced spring/early summer precipitations, as perhaps the future of climate trends for this region.”
Bloomington relies on Lake Monroe as a source of drinking water. Does a higher level of water this time of year affect the operations for city of Bloomington utilities (CBU)?
Director of CBU, Vic Kelson, responded to an emailed question about that by saying, “Rainfall typically brings turbidity into the lake upstream of the plant, and can affect influent turbidity, but it really doesn’t affect the plant operation.”
Kelson added, “In the grand scheme of things, the dynamics of the lake water level have a very small effect overall. Our operators are trained to deal with seasonal and short-term changes in influent water quality, and we monitor the process very closely.”
Lake Monroe’s water level depends in part on how much water is allowed through the dam at Harrodsburg. The three gauges downstream from there, at Bedford, Shoals and Petersburg, have to be below minor flood stage, before more than the minimum 200 cubic feet per second is allowed through the dam.
Minor flood stage means 20 feet in Bedford and Shoals, and 16 feet in Petersburg. Based on current levels shown by the US Geological Survey gauges at those three locations, the levels are dropping, but are not all low enough to allow more water through the dam.


Comments ()