Census 2020 analysis: Lower numbers in Bloomington’s student neighborhoods point to possible undercounting

The 1.5-percent decrease in population reported for Bloomington by the US Census last week has generated local skepticism about the accuracy of the count.
The most recent estimates from the US Census had pegged the city’s population at around 86,000. But the 2020 numbers came in under 80,000, less even than the actual count in 2010.
The result was a big enough surprise that the city’s mayor, John Hamilton, issued a statement last Friday, the day after the results were released. The statement raises the possibility that the reported numbers are not accurate, because of an undercount of Indiana University students.
Hamilton’s statement points out: “[M]uch of the census data collection began the very week thousands of university students were directed to leave for the semester due to the COVID pandemic.”
If an undercount of university students contributed to Bloomington’s lower numbers, the undercount would likely be detectable in the geographic distribution of population losses in Bloomington, as counted by the US Census.
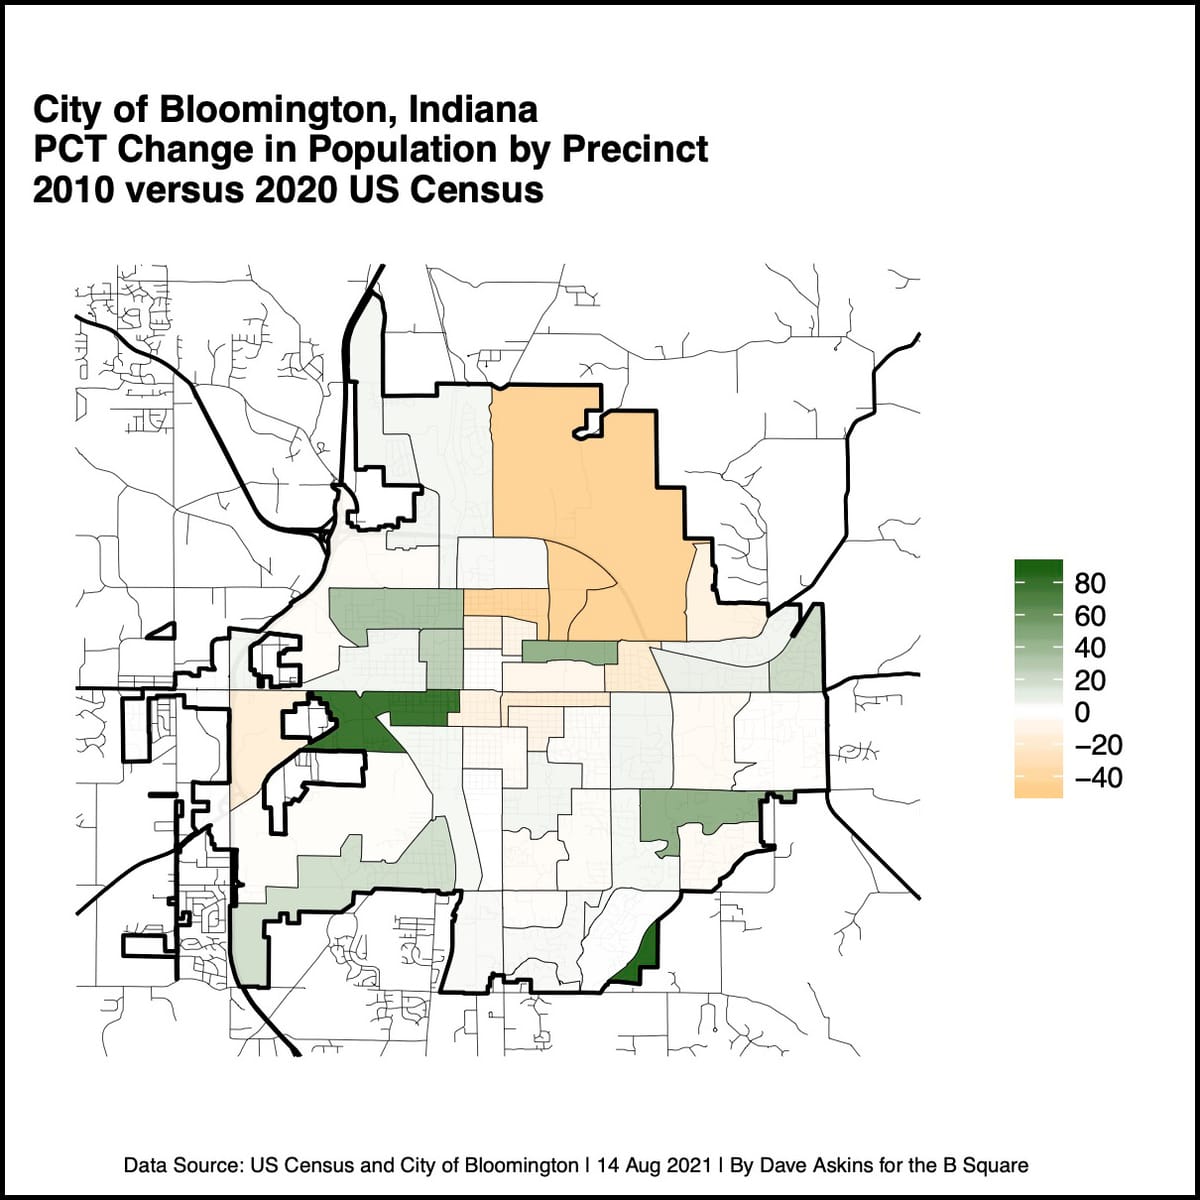
Based on a B Square plot of precinct population counts in 2020 compared to 2010, the idea that college students were undercounted has some statistical support.
It was predominantly areas on and near the Indiana University campus that showed lower counts in 2020 compared to 2010.
Areas that lost population, according to the US Census count, are shaded orange on the map that accompanies this article. Areas shaded white or nearly white showed about the same count in 2020 as in 2010. Areas that increased in population, according to the US Census count, are shaded green.
By way of example, if the 2020 US Census figures are correct, the Bloomington 03 precinct lost 45 percent of its population over the last decade, dropping from 3,517 to 1,942 residents.
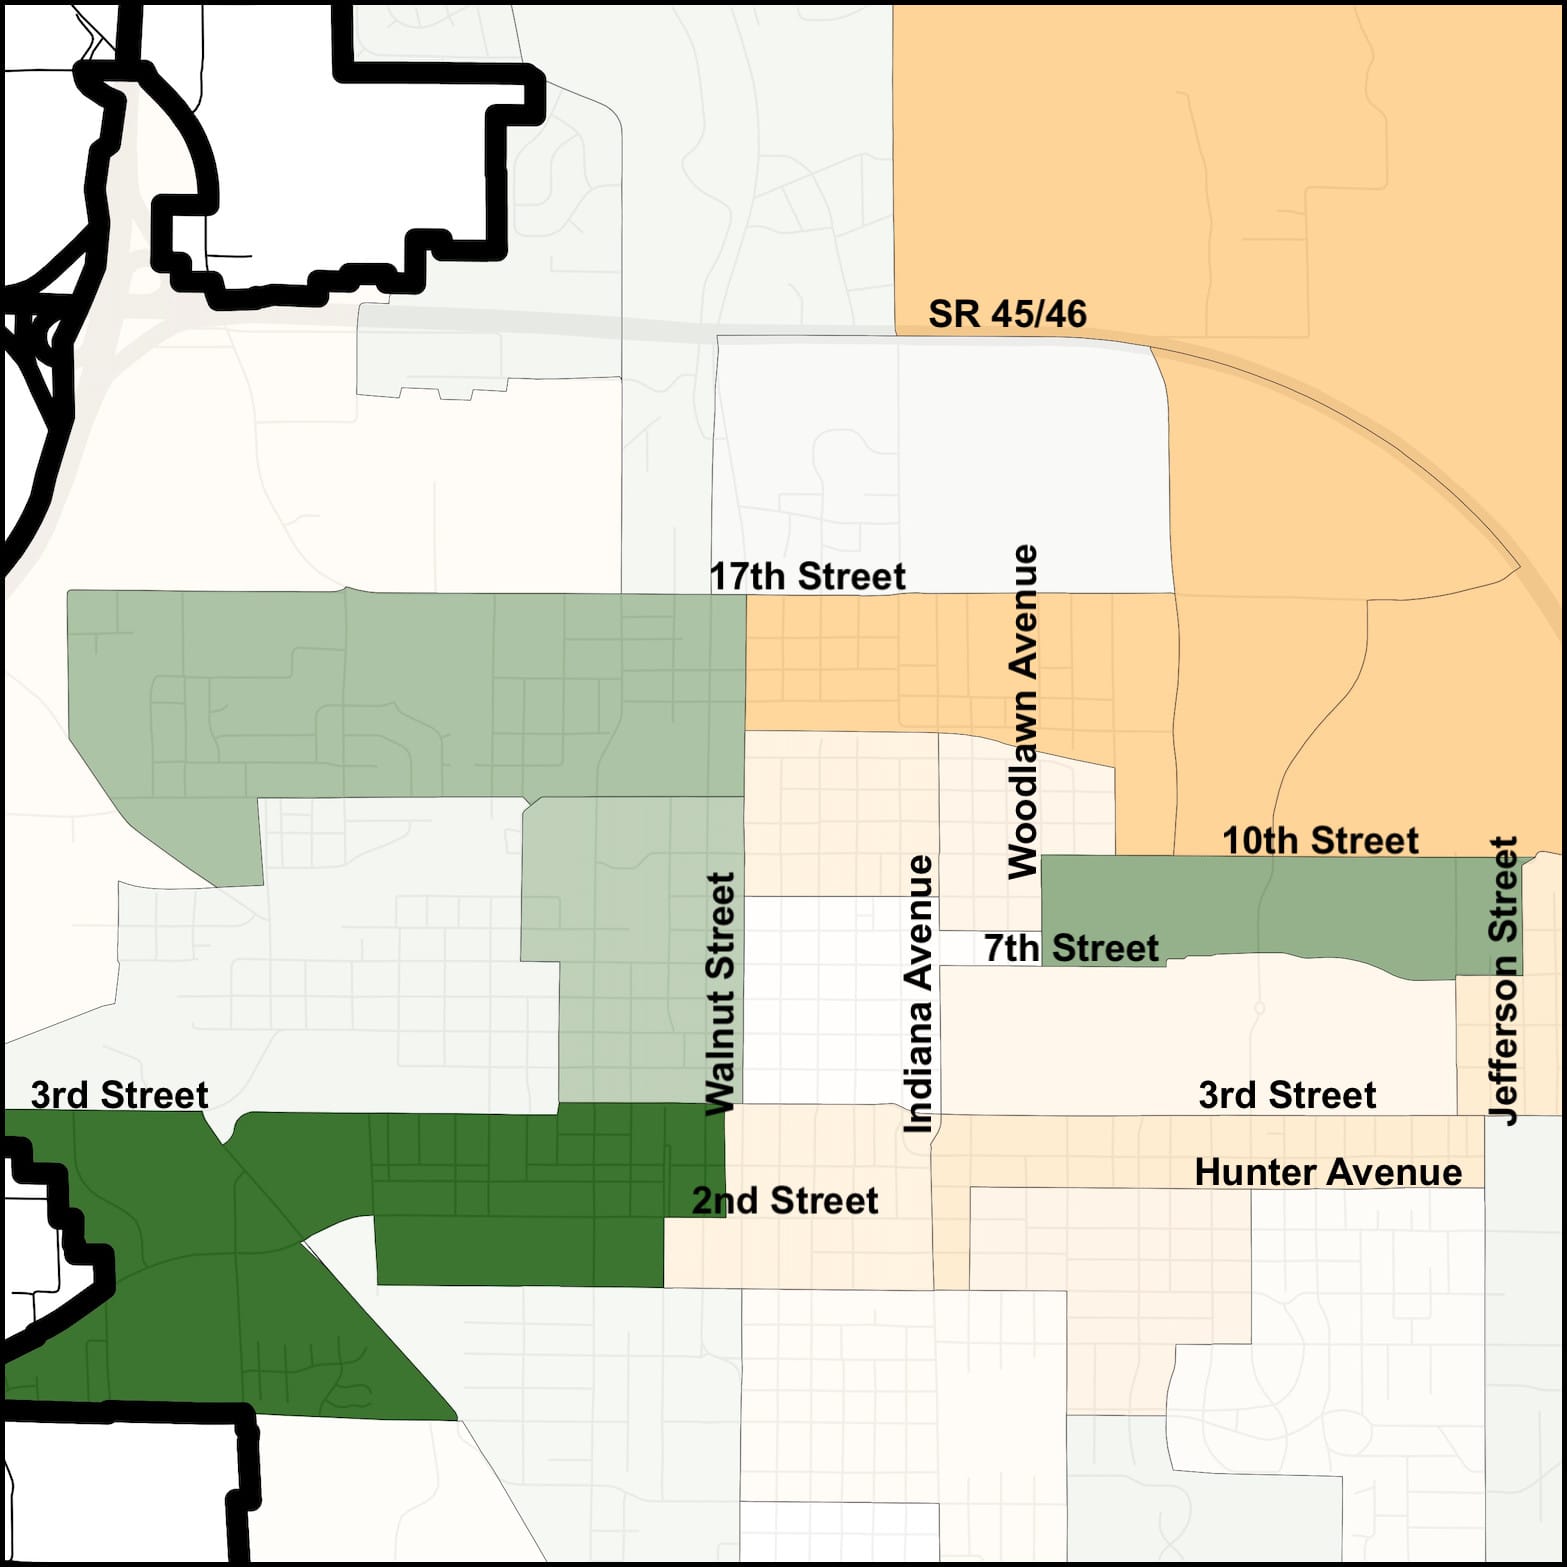
Bloomington 03 covers roughly the area bounded by Walnut Street, 17th Street, Fee Lane, and 14th Street. That’s a neighborhood just south of the football stadium with a high student population.
If students were generally undercounted, what explains the green slab of an area (reflecting a substantial increase), bounded by Woodlawn Avenue, 10th Street, Jefferson Street and 7th Street? It’s part of the IU campus.
A combination of factors might have caused the increase. According to IU’s campus map, in 2010 the university built a cluster of new dorms there, named after trees: Beech, Cyprus, Linden, Pine, Cedar and Birch.
Another possible factor was the university’s adoption this year of a group-quarters reporting approach to the census.
A group-quarters approach basically means that the university completes the census on behalf of the student residents of the dorms.
Even if a student, or their parents, were to complete the census separately from the group-quarters report, and did so inaccurately, it would not negate the university’s report. The US Census told The B Square in 2020 that in the “back-end” process for reconciling and de-duplicating data, the group-quarters report supersedes other records for the same person.
The US Census has a process for “appealing” the counts, called the Count Question Resolution (CQR) program.
Bloomington mayor John Hamilton’s statement last Friday stated, “We will be exploring all options to assure a correct count of our population.”
The deadline specified in the CQR process for a governmental unit to submit a case on the 2020 census count is June 30, 2023.
Given the timeframes, that could mean that Bloomington will have to live with the results of the census for upcoming tasks like the 2022 redrawing of the city council district boundaries.
Independent of potential annexation impacts, the city council districts look like they will need to be adjusted to balance out the gains and losses recorded in the 2020 census counts.
Table: Bloomington city council district population
| District | Population Count 2020 | Population Count 2010 |
| District 1 | 15,379 | 13,677 |
| District 2 | 12,985 | 12,868 |
| District 3 | 12,746 | 13,926 |
| District 4 | 13,223 | 13,500 |
| District 5 | 14,057 | 13,672 |
| District 6 | 10,783 | 12,765 |
The 2012 districts were drawn based on a goal of less than 10-percent variance, where variance is defined by the biggest district’s population minus the smallest district’s population divided by the mean of the population in the six districts.
The 2012 council districts came in at 8.6 percent. The result of the 2020 census count would make the variance for Bloomington’s districts 34.8 percent.
Council districts are mentioned in the annexation ordinances that Bloomington’s city council will consider in mid-September. Each ordinance has to assign the proposed annexation area to a city council district.
District 6 does not touch any non-city area, so it’s not mentioned in any of the annexation ordinances. District 3 is also not included as a district that would have any territory added to it as the result of annexation.
Data sources
The B Square extracted the precinct-by-precinct population data for 2020 from the data that was released last Thursday by the US Census.
The 2010 census data for precincts does not reflect the current configuration of precincts in Monroe County. So Bloomington’s 2010 precinct population breakdown was pulled from the records of the Bloomington city council’s 2012 work on redrawing the council district boundaries.
[Google Sheet with Bloomington precinct population numbers 2010 and 2020]

Comments ()