Monroe County hits one benchmark for pandemic cases, but far from trigger to lift mask mandate

This time last year, the county saw a dramatic increase in cases, associated with a major new wave. This year the trend is expected to continue downward, even if the decline is slow.

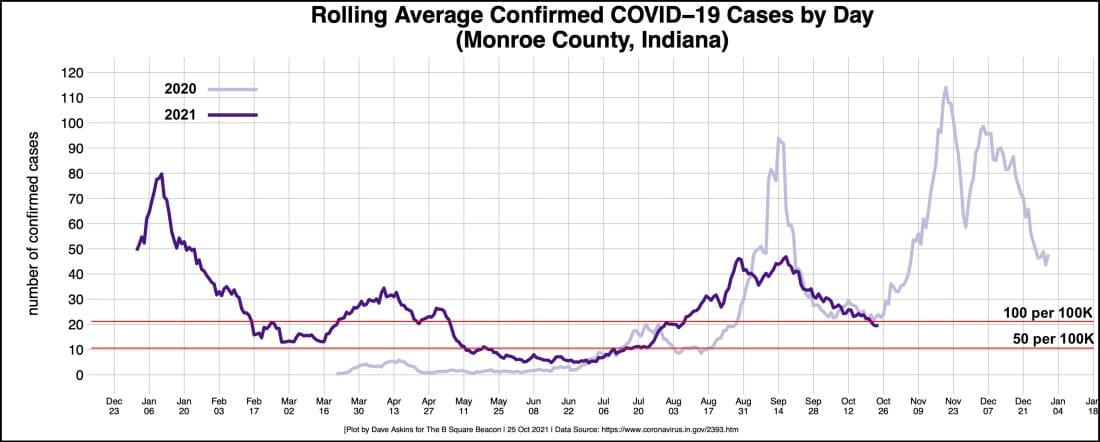
Sunday’s 14 positive COVID-19 cases for Monroe County contributed to a rolling 7-day average of 19.7 cases.

That’s good news, in terms of the state’s metrics for community disease spread. But it still leaves the county at about twice the number of daily cases needed for an automatic lifting of the indoor mask mandate.

The county’s board of health voted to extend the mask mandate at its meeting last week. The lifting of the mandate is not tied to a date, but to a specific benchmark.  That benchmark corresponds to a rolling 7-day average of 10.6 cases a day, which is about half the current number.

County commissioners are set to vote on the extension of the mask mandate at their regular Wednesday morning meeting.

The rolling 7-day average through Sunday is just under 21.2, which is the number that corresponds to 100 weekly cases per 100,000 residents.

The 100 cases per 100,000 residents is a key benchmark for the state of Indiana’s health department. Coming in below that benchmark puts Monroe County in the second-best category for the state’s cases-per-capita statistic.

For the other statistic used by the state, which is positivity rate, Monroe County is in the best category, at 4.3 percent.

The scoring of the two categories goes from 0 for the best to 3 for the worst. So the average of Monroe County’s scores in the two categories—a 1 for per capita cases and a 0 for positivity—works out to 0.5.

A 0.5 average means that on Wednesday, when the state announces the new classifications and releases a new map, Monroe County will shaded blue. The blue shading designates the best category in the state’s four-color scheme. From best to worst the scheme goes: blue, yellow, orange, and red.

But under the state’s scheme, only when a county achieves a score of 0.5 or lower for two weeks in a row, is it officially in the blue category.

Under the health regulation’s terms, to see an automatic lifting of the mask mandate, Monroe County will need to stay in blue and get its case numbers down to 50 per week per 100,000. That per capita stat works out to a rolling average of 10.6 a day.

Eyeballing the current rate of decrease, it could be overly optimistic to think that average daily case numbers would drop from around 20 to 10 over the next week.

3 thoughts on “Monroe County hits one benchmark for pandemic cases, but far from trigger to lift mask mandate

  1. Thanks, Dave. Can you speak to the statistical effect of IU’s mitigation testing on the positivity rate (is the State still mixing it into County stats)? And how IU’s stated 93% vaccination rate impacts the County vaccination rate for the non-IU affiliated community? I thought Dr. Wrenn’s statement about making that distinction during the Board of Health meeting on extending the mask mandate was well-taken.

    1. Re: statistical effect of IU mitigation testing. Yes, the mitigation testing by IU is, as far as I know, still included as part of the county’s stats. It’s pretty well established that a large number of mitigation tests on a random pool, as opposed to people who have some reason to think they might have COIVD-19, are going to damp down the positivity rate. Here’s a chart I built early this year showing the effect of IU’s mitigation testing on the county’s positivity rate: chart. IU’s mitigation testing program is now confined to just those who are not vaccinated (7 percent of IU affiliates), so the effect is smaller. This season I have not done more than just eyeball it.

      Re: Wrenn’s remark about IU’s high vaccination rate. For the benefit of readers who didn’t track that, here’s how The B Square reported it:

      Given that Monroe County’s overall figure stands at around 60.7 percent vaccinated, Wrenn reasoned that the vaccination rate for the non-university population must be lower, if IU tips the scale upward.
      Wrenn asked, “Shouldn’t we continue being careful about opening the door, if our community is not vaccinated?”

      Anyhow, the university’s mitigation testing and high vaccination rate can be analyzed as contributing to the relatively better scores on the state’s metric, compared to other counties. Board of health members also believe the mask mandate through be included in the mix as a contributing factor to the county’s relatively better scores. It’s probably possible to apply fancier statistics than I know how to do, to try to isolate and measure the mask mandate’s contribution, if any.

      What seemed to be persuasive to Wrenn was the idea that the non-university community can’t rely on its high vaccination rate alone—because it’s actually not all that high. So Wrenn reasoned that given that the non-university population does not enjoy a particularly high vaccination rate, whatever additional tool the board might have available (like a mask mandate), should also be used.

Comments are closed.