Analysis: Three years, two parties on Bloomington’s all-Democrat city council

Whenever there’s a 5-to-4 or 4-to-5 tally on the nine-member Bloomington city council, it’s become a pretty standard joke: Did the vote fall along party lines?

It’s only funny because all nine members of the city council are Democrats.
And the make-up of “the five” and “the four” has been consistent enough that it will draw a knowing chuckle from close watchers of the council.
It’s not just a gut feel. There’s statistical support for the idea that there’s a “party of five” and a “party of four” on the Bloomington city council.
In 2022, there were 16 votes that split the council on a one-vote margin—5–4 or 4–5.
In 13 of the 16 votes, the breakdown of “the five” was: Susan Sandberg; Jim Sims; Sue Sgambelluri; Ron Smith; and Dave Rollo.
Making up “the four” were: Matt Flaherty; Kate Rosenbarger; Isabel Piedmont-Smith; and Steve Volan.
When close observers of the city council refer to “the four” and “the five,” that’s the grouping they mean.
In 2022, for two of the 16 votes with a one-vote margin, it was the same grouping for “the four” and “the five”—except that Sgambelluri was subtracted from “the five” and added to “the four,” making them five.
The same pattern of “the four,” but with Sgambelluri as an added fifth vote, was relatively more frequent in the previous two years. It happened about as often as a split between “the four” and “the five.”
In 2020 and 2021, there were 14 votes with a one-vote margin. In 4 of those 14 votes, Sgambelluri counted as the fifth vote for “the four.” In 5 of the 14 votes, Sgambelluri counted one of the group that is called “the five.”
Of the first three years of this edition of Bloomington’s city council, it was just 30 out of 915 roll-call votes that split the council on a one-vote margin.
But if all the other votes are thrown into the statistical mix, it’s possible to see how the pattern of “the five” and “the four” has emerged year by year.
Analyzing voting patterns
To analyze voting patterns, the approach taken here does not identify general topic areas and “score” councilmembers based on their voting record on different issues.
Instead, the idea is to consider each councilmember’s voting record as a mathematical object—a list of ones, negative ones, and zeros.
This approach does not consider the subject matter of the votes at all. Every vote is included, and they’re all weighted the same. For example, the vote on the annexation of a territory counts the same as a procedural vote on referral of an ordinance to a committee.
Because the analysis is blind to the content of the votes, it might be considered completely objective. It’s just a mathematical computation. That can be viewed as a strength.
At the same time it is a weakness, because the result tells you something about a statistical pattern of votes, but gives no insight into why the patterns look the way they do.
It’s at least a place to start.
A yes is assigned a “1”; a no a “-1” and non-participation a “0”. Non-participation due to absence or abstention are both assigned a “0.” The distance between those mathematical objects, a kind of voting vector, is computed for each pair of councilmembers.
Having a list of distances between every pair of councilmembers is not especially useful for understanding the big picture.
In the same way, having a list of distances between every pair of nine cities would not be useful as a navigational tool. What’s needed is a way to convert those pairs of distances into a map—a two-dimensional plot with nine cities located on it.
A statistical technique called Multidimensional Scaling is a way to transform the distance pairs into a map. That’s the technique that was used to generate the plot below which covers all the roll call votes since the current edition of the city council was sworn into office on Jan. 1, 2020.
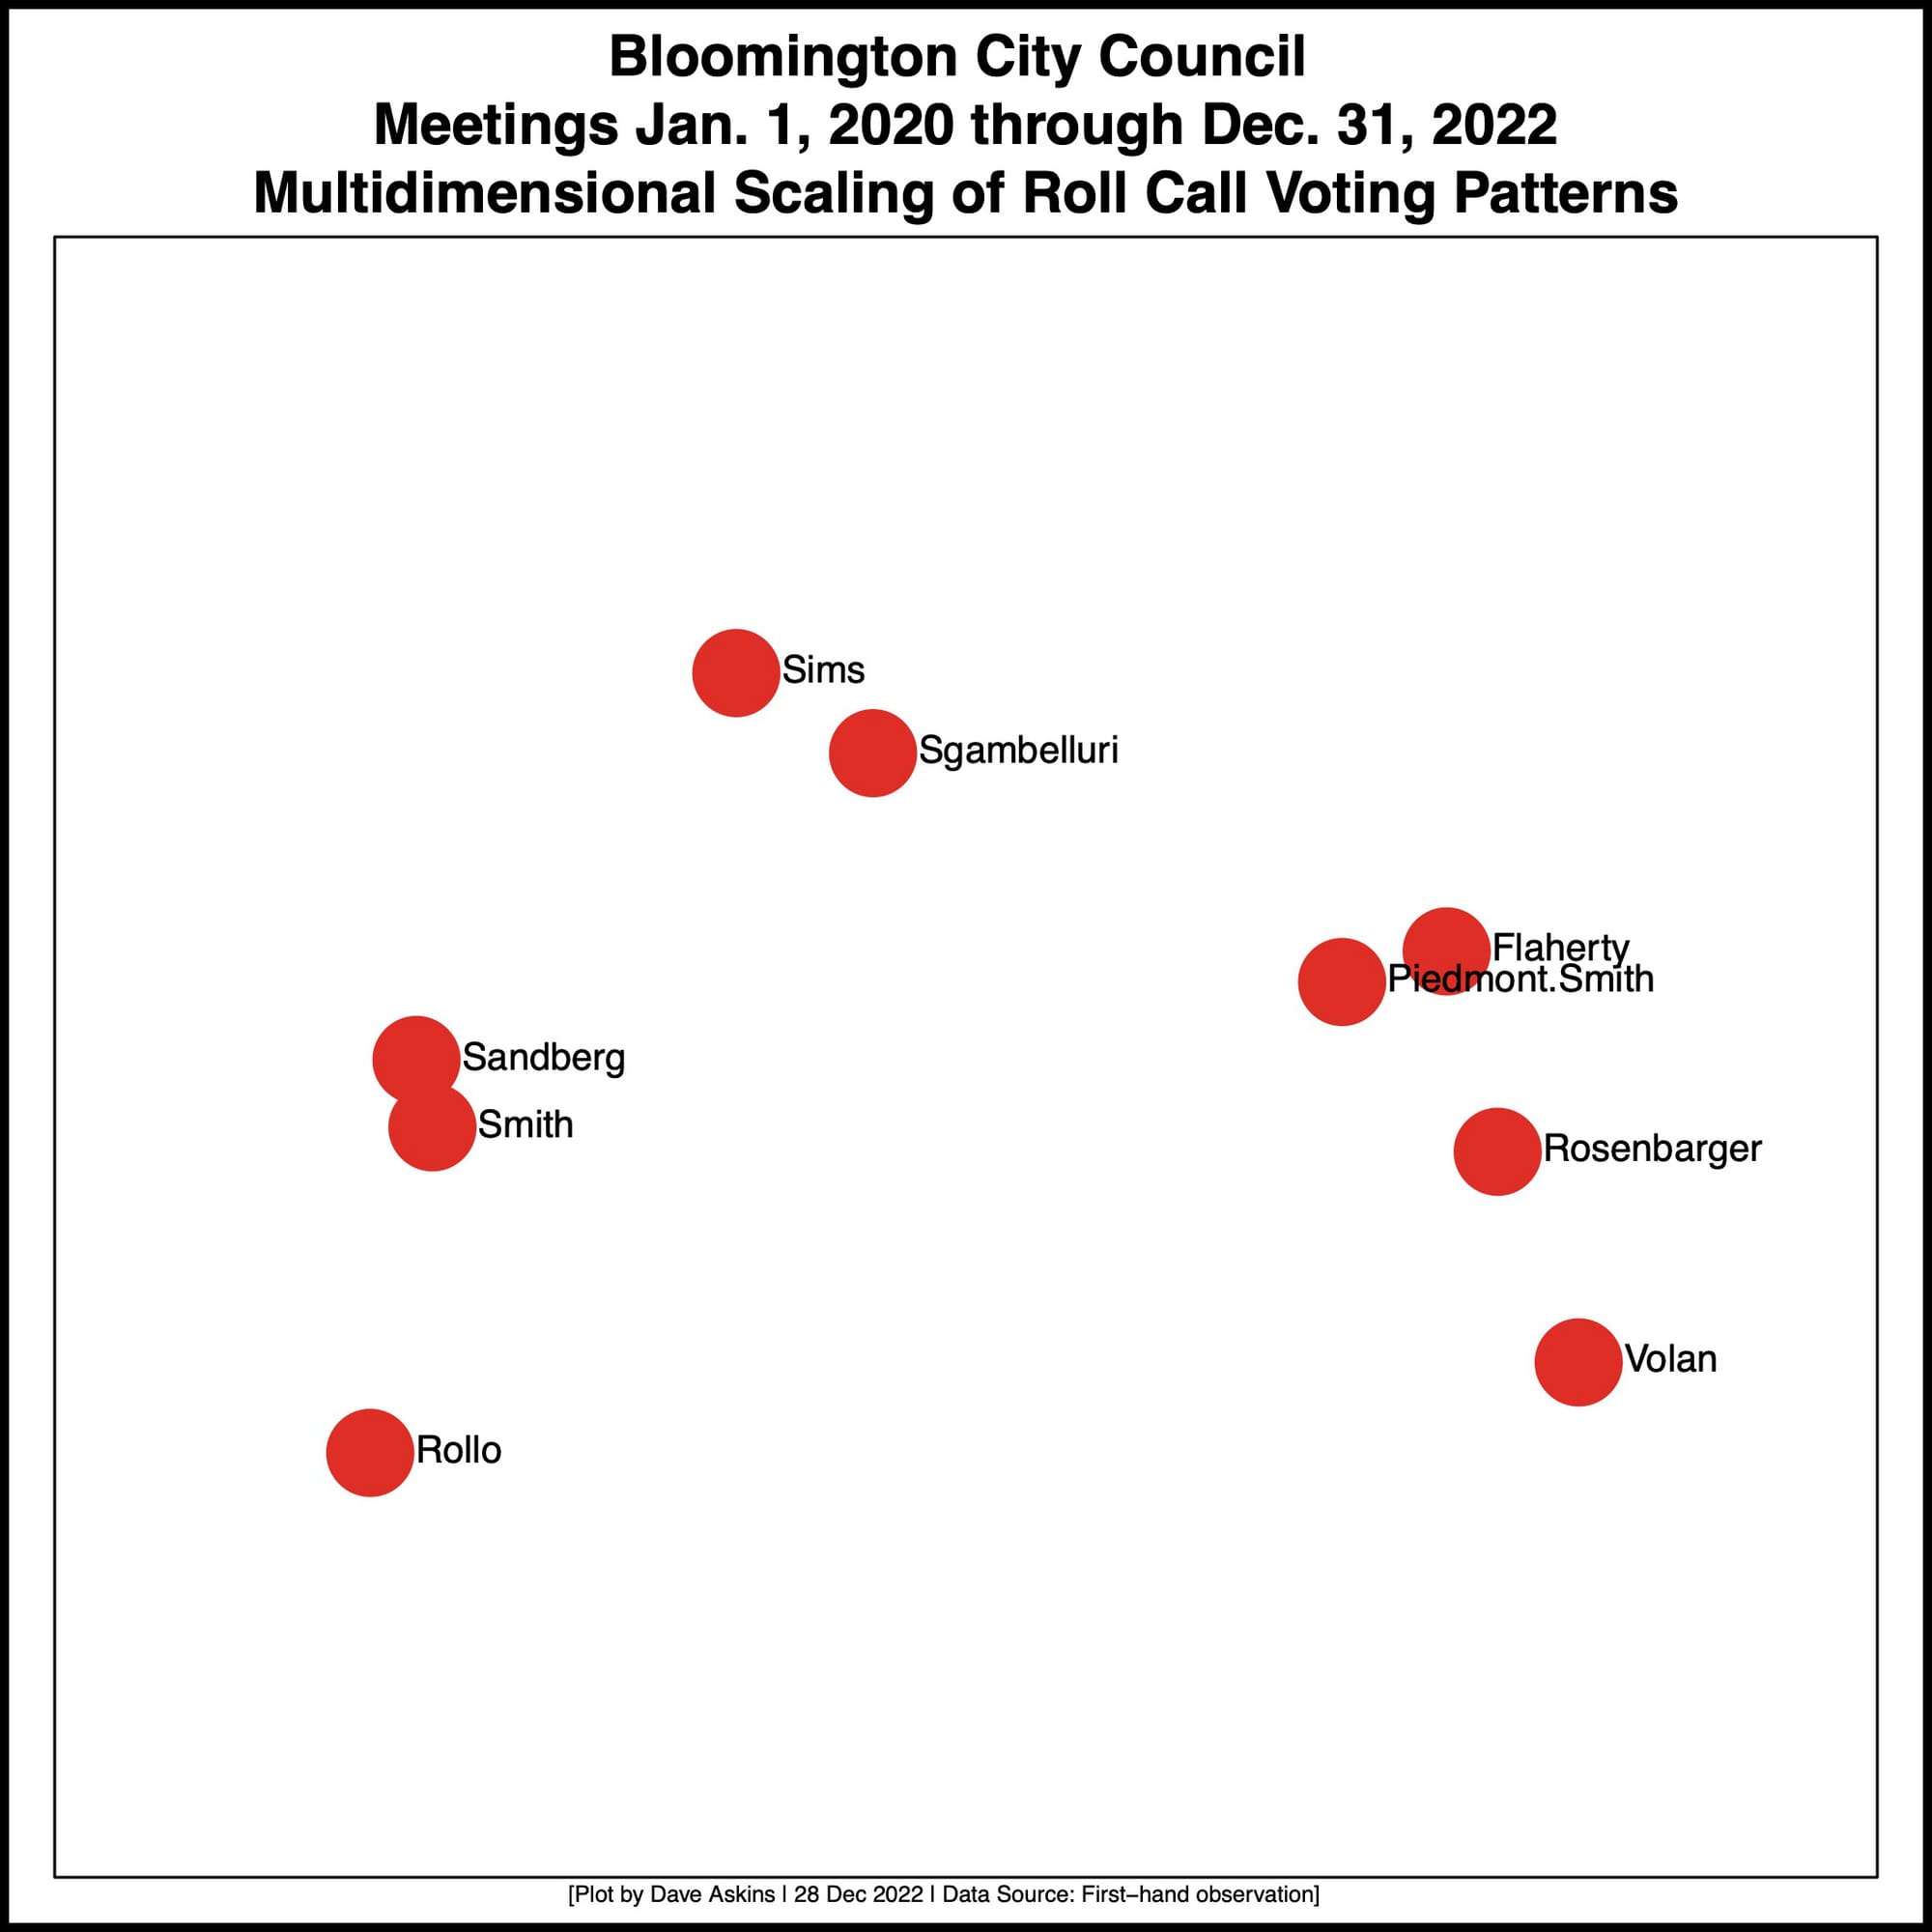
In the plot, left and right don’t indicate anything in particular about political leanings. Neither do up and down.
The only inferences to be drawn from the plot are about pairs of dots in relation to other pairs. If one pair of dots is closer than another pair, then the councilmembers in the closer pair have more often voted alike than the councilmembers in the more distant pair.
The divide between “the five” and “the four” over three years is evident. But it emerged incrementally.
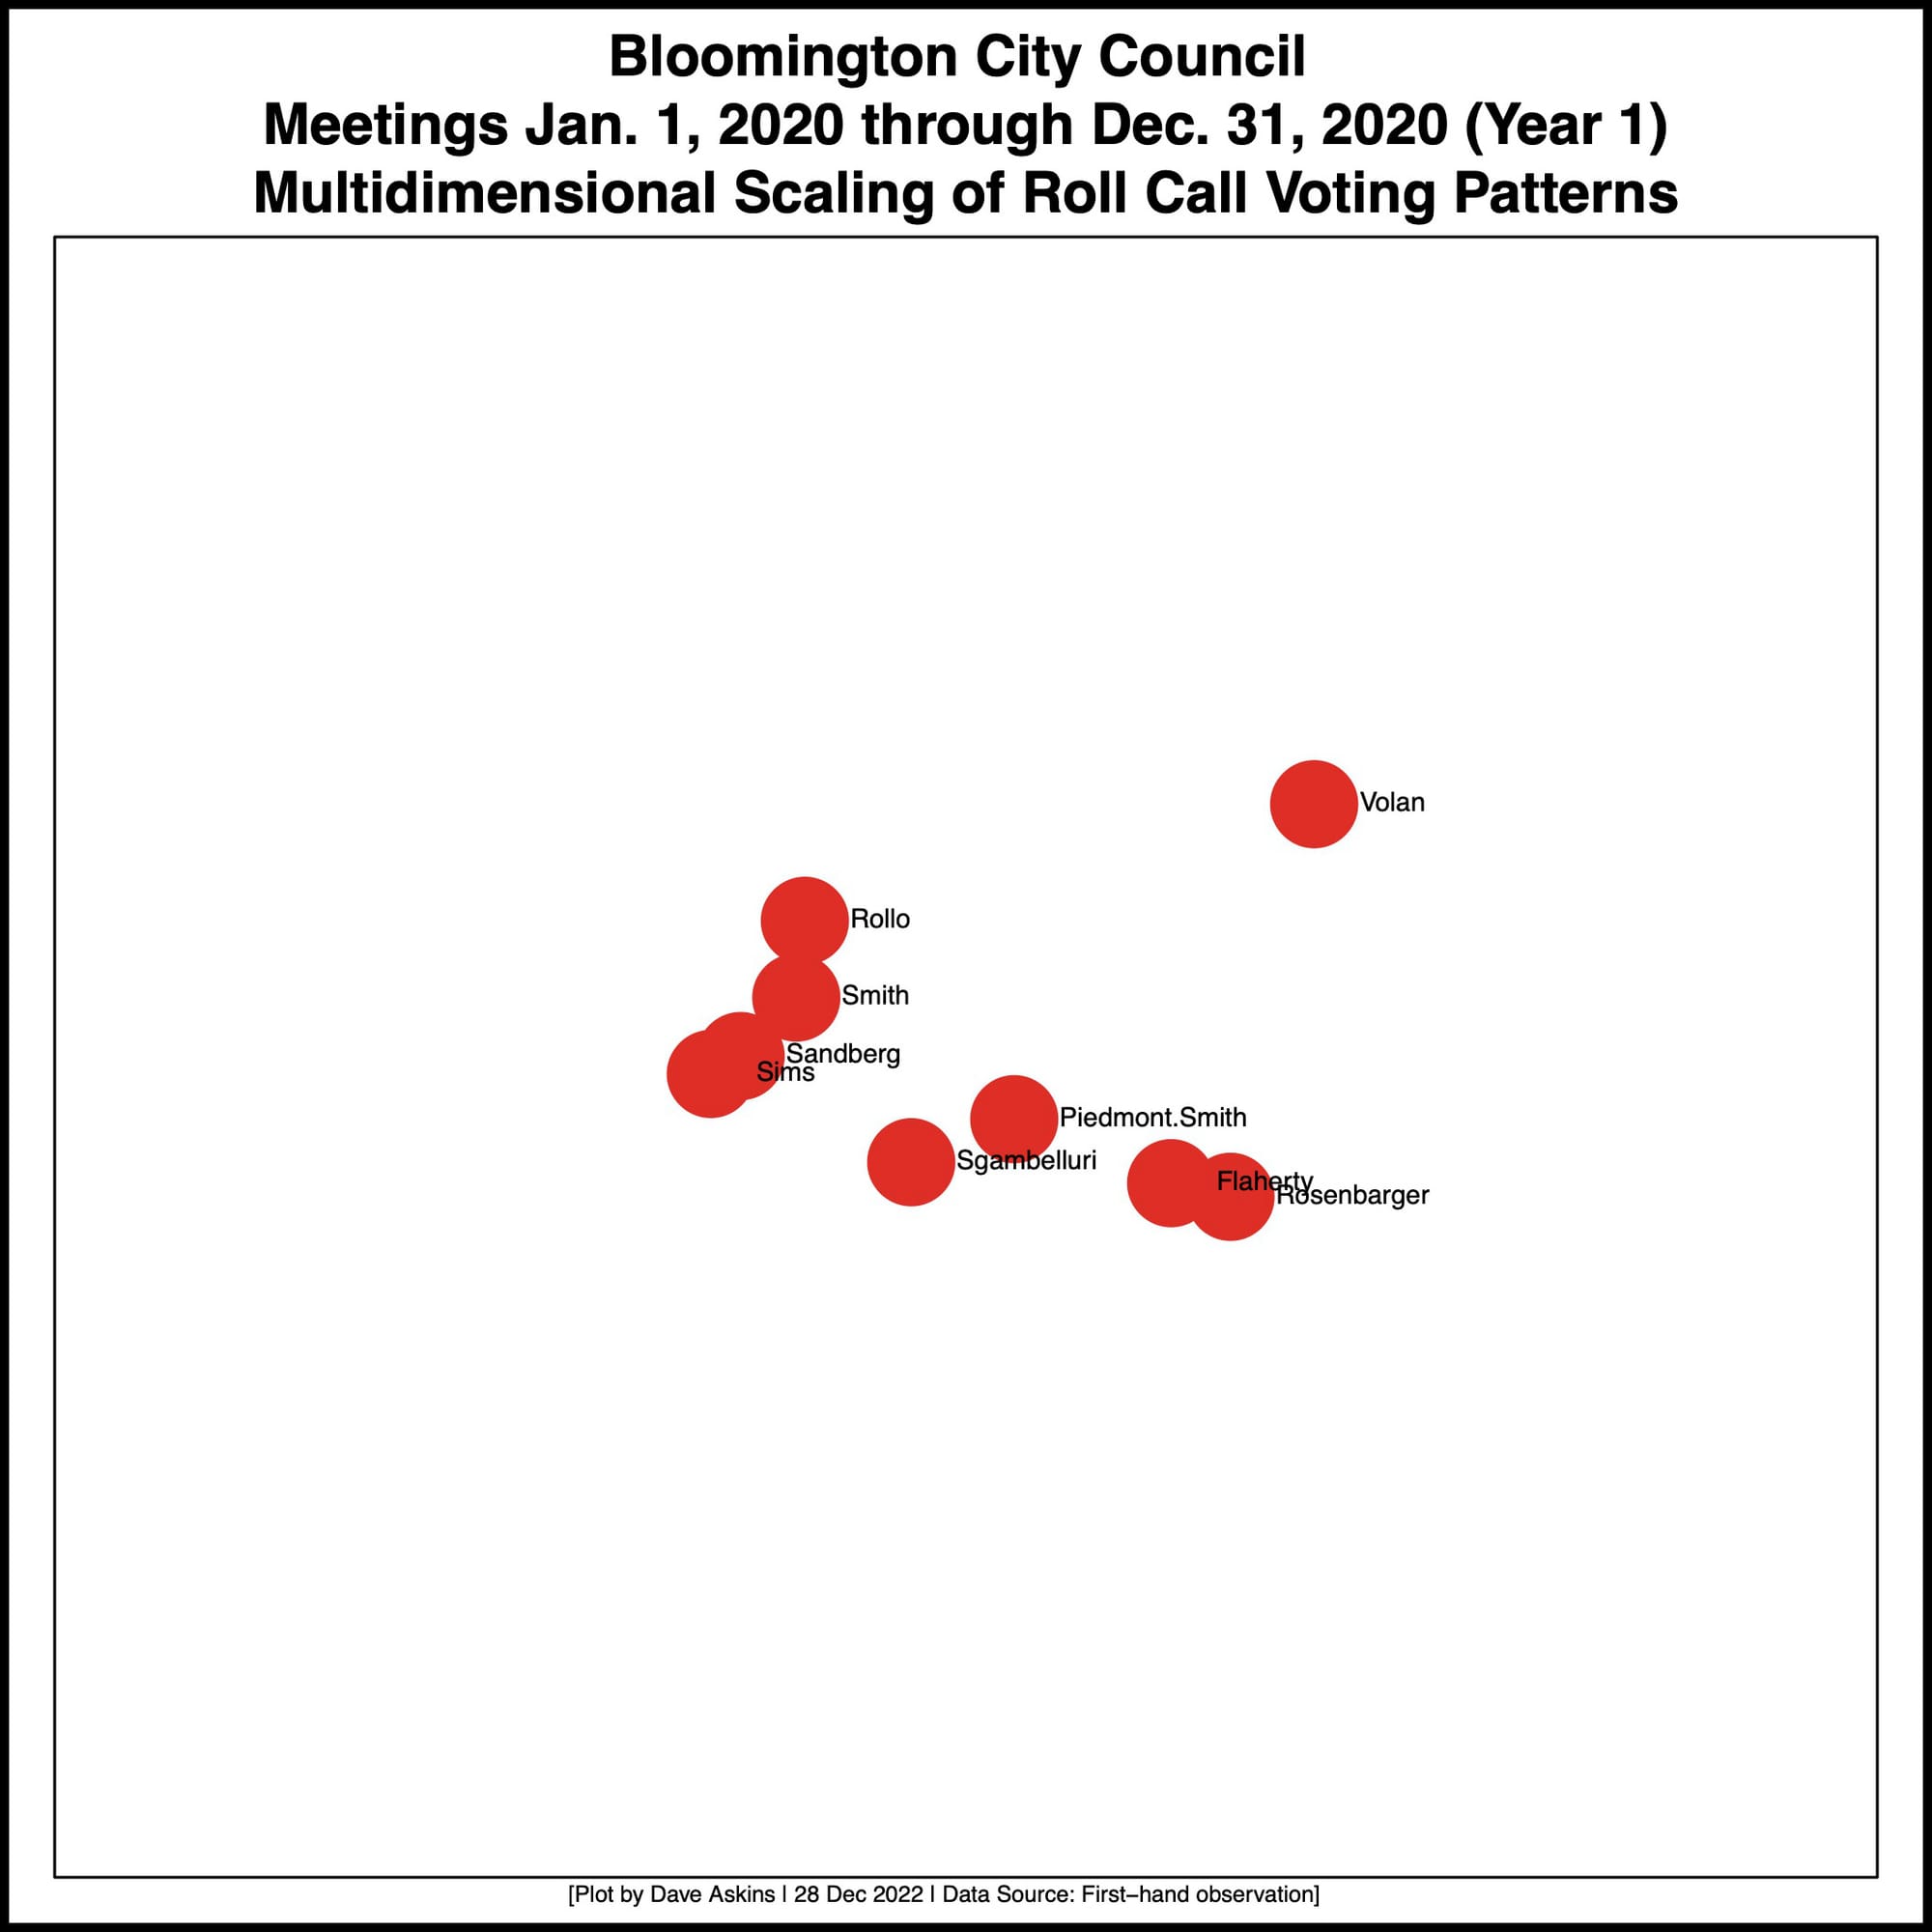
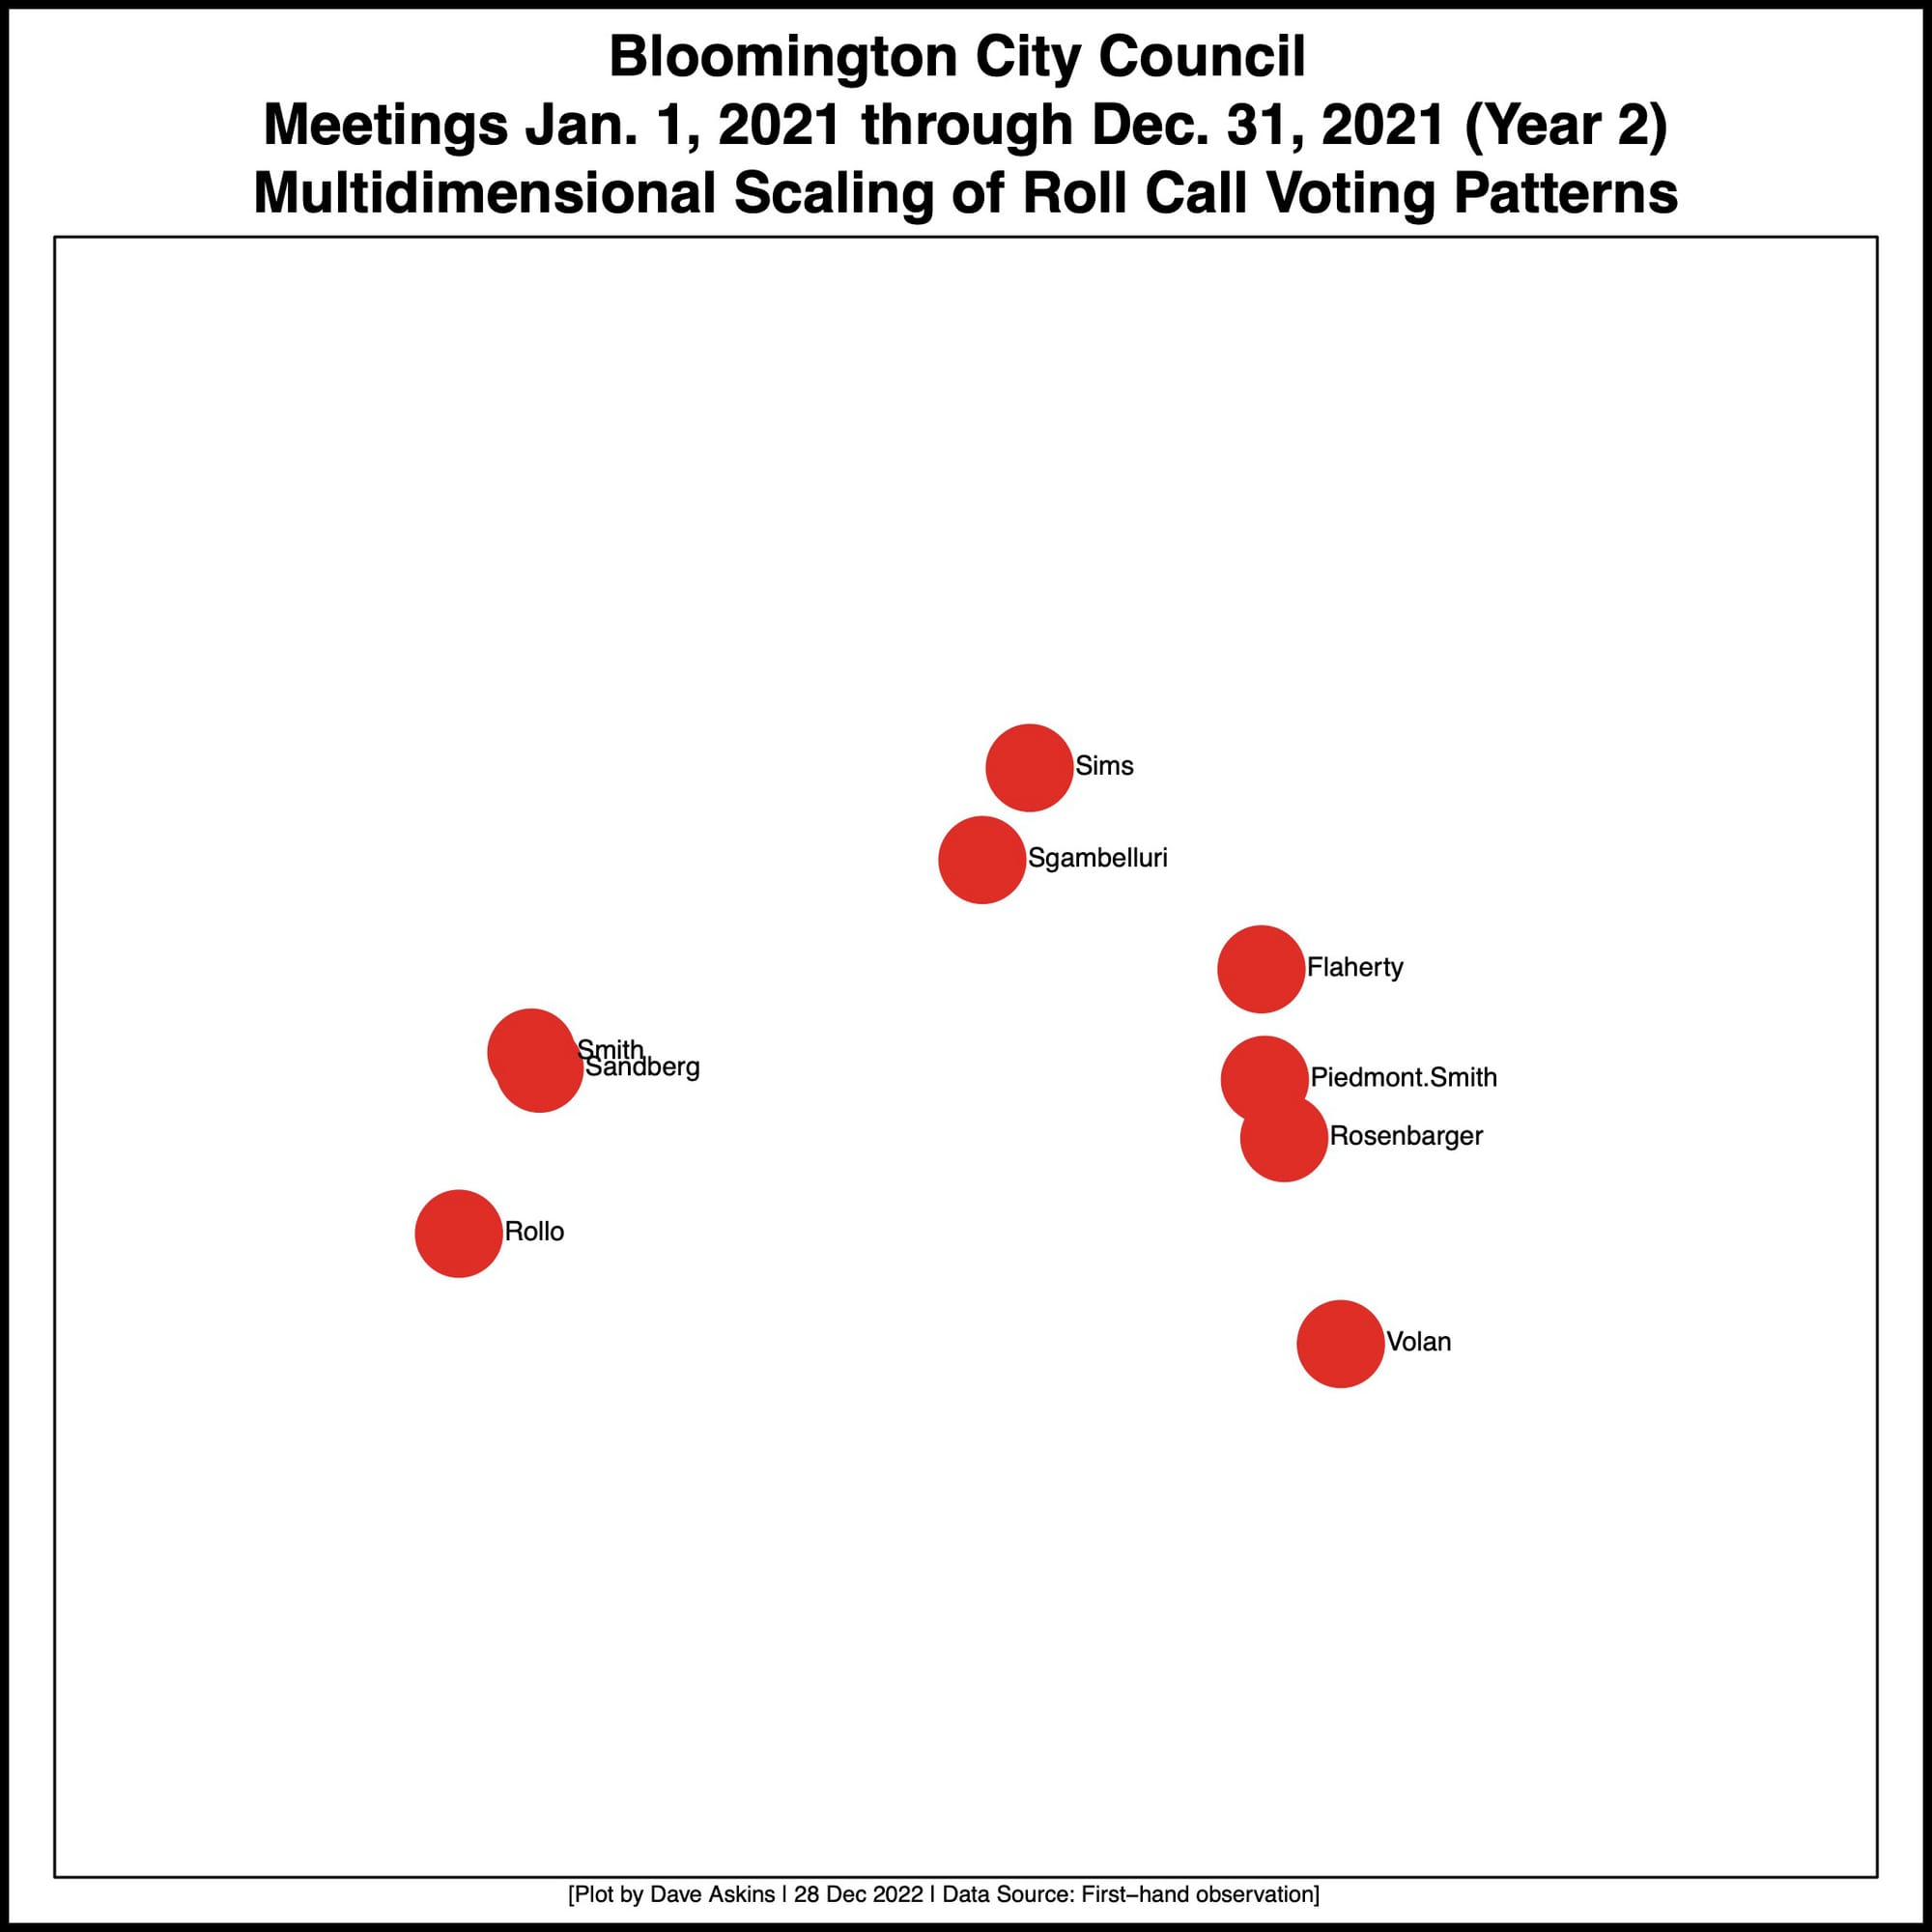
Analyzing each year’s votes separately shows that the split began as one that had Sgambelluri more closely aligned with Flaherty, Rosenbarger and Piedmont-Smith.
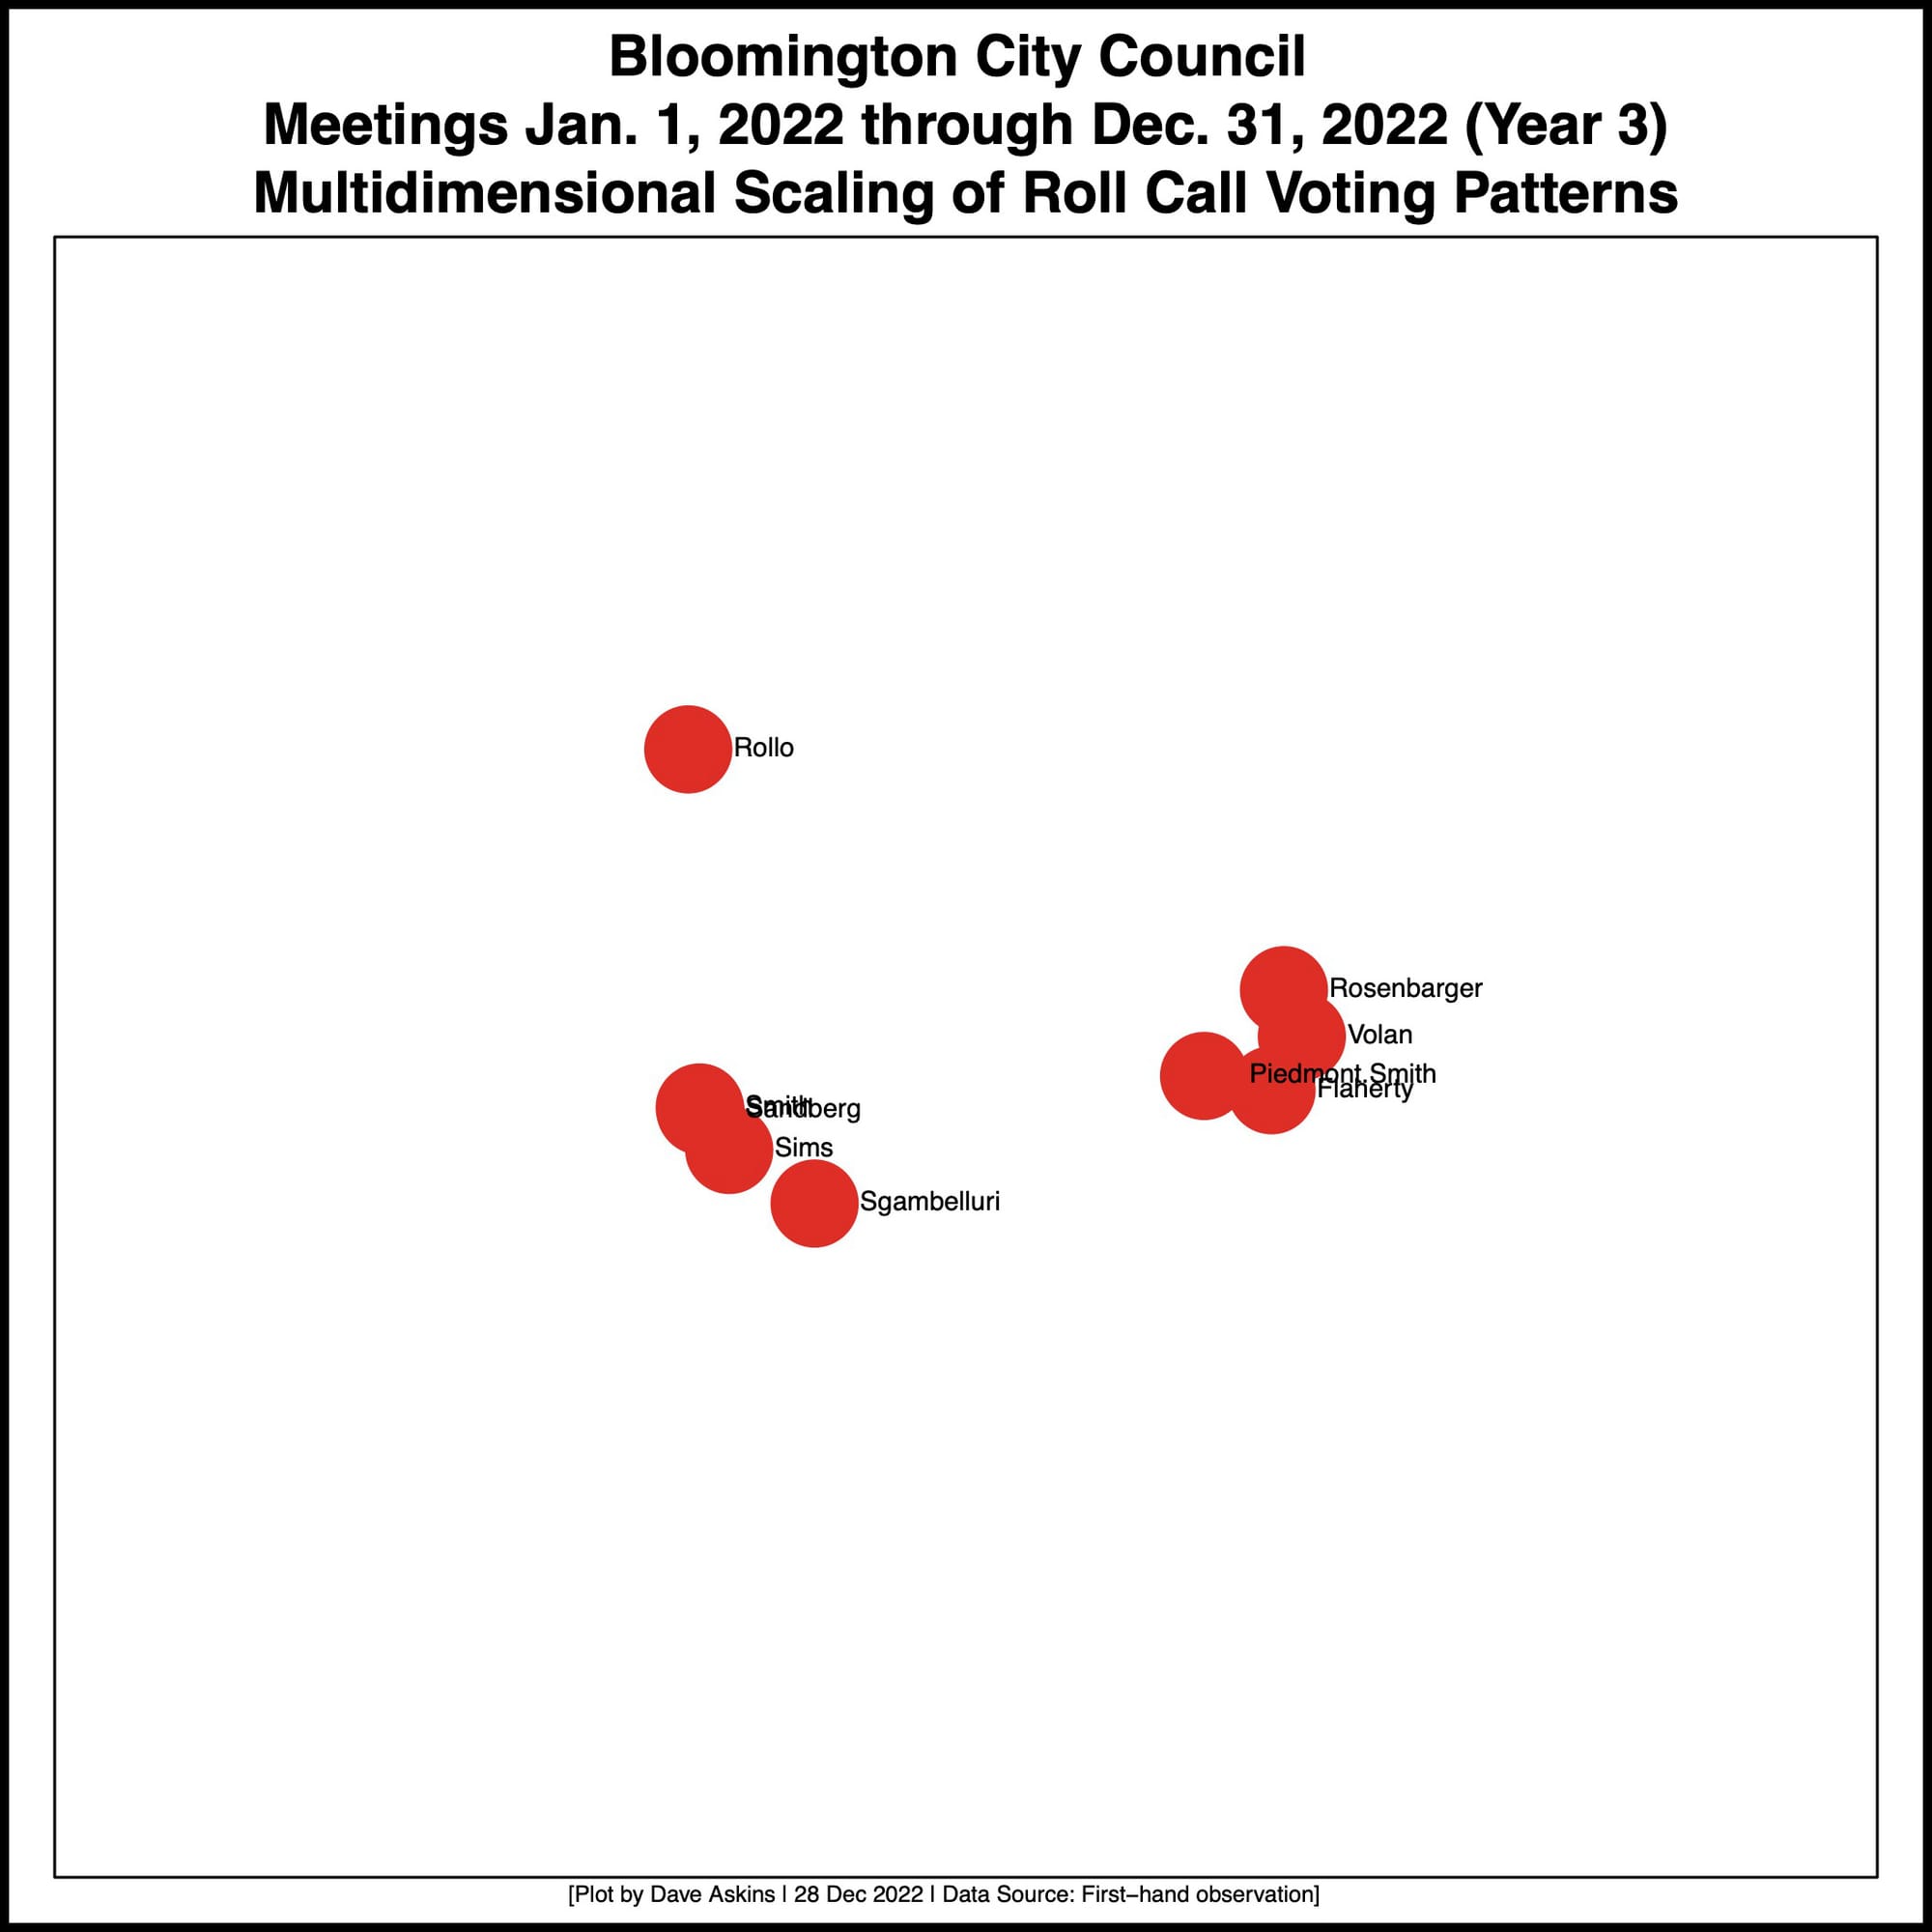
This year, the split between “the five” and “the four” showed up in the first votes the council took, in early January of 2022. That’s when the council elected a president, vice-president, and made its appointment to the plan commission.
In January 2022, Sandberg was elected city council president, Sgambelluri was elected vice president and Ron Smith was appointed to the plan commission—all along “party lines.”
The coming year in 2023 marks the fourth and final year for this edition of the council. All nine council seats are up for re-election. The first day of early voting for the primaries is a little more than three months away—April 4, 2023. The primary elections fall on May 2.
When the council convenes its first meeting of 2023 on Jan. 11, the election of a new president and vice president will be the first chance for the watching public to see if “party-line” voting will persist in the final year of this council’s service.


Comments ()