Analysis of Indiana legislative voting patterns: Who’s outside the corral?
Analysis of information available on LegiScan—a website that provides robust tools for monitoring and tracking legislation in all 50 states—shows that legislators in the Indiana House and the Senate tend to vote along party lines.
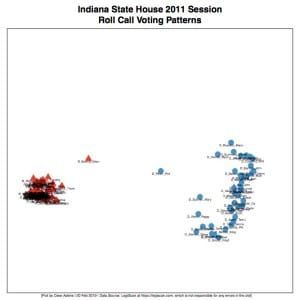
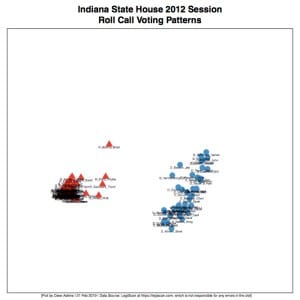
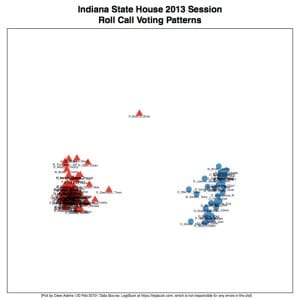
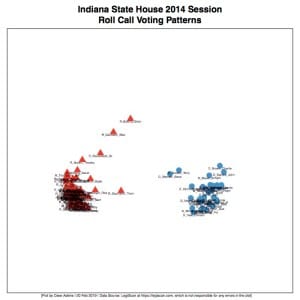
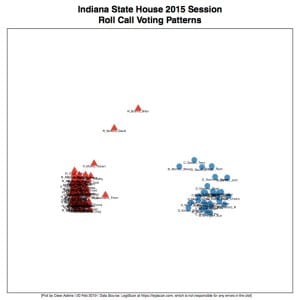
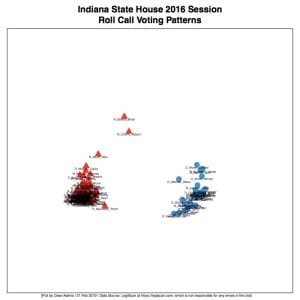
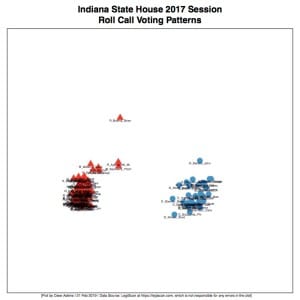
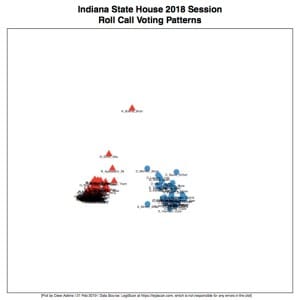
Lawmakers voting along party lines is not exactly a revelation. But plotting out the voting patterns of individual legislators, to see how they cluster, might reveal some insights beyond the two clearly discernible herds. Which legislators are mavericks—clearly a bit outside their own party’s corral?
House plots (2011–2018)

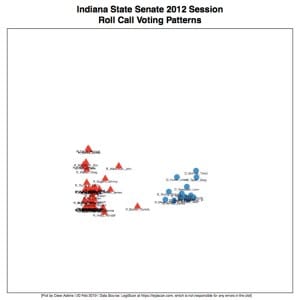
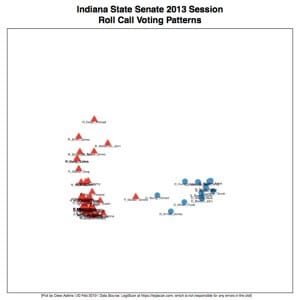
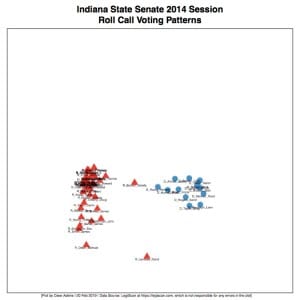
Senate plots (2011-2018)
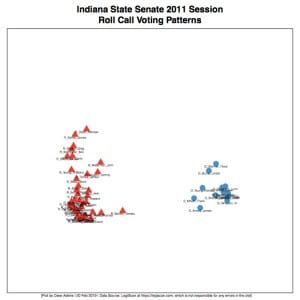
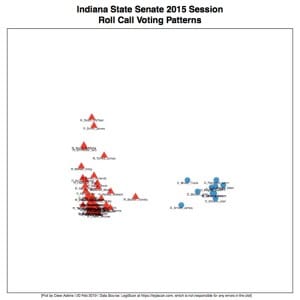
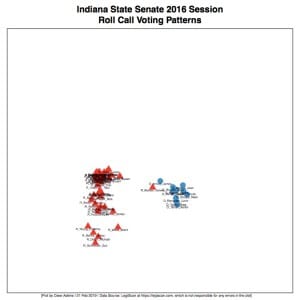
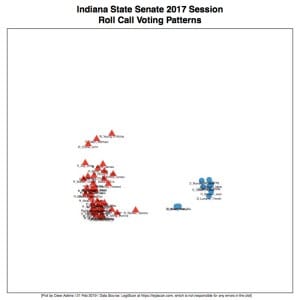
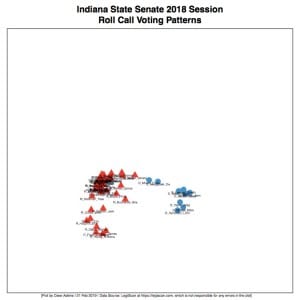
The plots above can be considered first drafts of an analysis. Some additional checks still need to be run. The statistical technique is called multi-dimensional scaling.
The idea is first to calculate the “distance” between every pair of legislators using their voting vectors—that is, their record of votes on every roll call. For this analysis, a Yea was assigned a “1”; a Nay a “-1” and non-participation a “0”. That gives us a list of pairwise “distances” between legislators.
Imagine having a list of distances between every pair of a hundred cities. That’s not useful as a navigational tool. What’s needed is a way to convert those pairs of distances into a map—a two-dimensional plot with cities located on it. Multi-dimensional scaling is a way to transform the distance pairs into a map. The plots above used multi-dimensional scaling to transform distances between pairs of legislators into a “map.”
The north, south, east and west on the “maps” above don’t correspond to any philosophical scale, like liberal or conservative. The one guiding principle to bear in mind for interpreting the plots is this: Two legislators who are closer on the map tend to be more alike in their voting records.
Coding non-participation as a zero means that some apparent mavericks probably aren’t actual outliers. So they likely don’t need to be rounded up by party leadership. Take Representative Brian Bosma, for example. The plots mostly show him to be grazing out in the far pasture away from the rest of the Republican herd. That’s likely because he is Speaker of the House, and the House rules don’t require him to participate in every vote.
If you don’t participate in a particular vote, it means that along the dimension of just that vote, you’re located some incremental distance away from anyone who voted Yea or Nay on that question.
Based on these initial plots, it looks like the 2011 and 2012 editions of the House Democrats were a bit less cohesive in their voting patterns than their Republican counterparts. And in all eight years, Senate Democrats were more cohesive in their voting patterns than Senate Republicans.


Comments ()