Analysis: Small, older batch of voters will decide Bloomington municipal elections this year
The headline for this piece is unlikely to surprise anyone with just a scant knowledge of local Bloomington politics or national election trends.

Still, it’s worth adding some precision to some general ideas. Bloomington’s quadrennial municipal elections—held the year before presidential contests—attract few voters. And those who do vote are older than average.
Based on turnout in past years, I think maybe 1,500 voters will participate in Bloomington’s Nov. 5 elections. That’s about 3 percent of city voters in the registered voter file provided by the Monroe County election supervisor’s office in early July.
Based on participation in past elections, more than half of those 1,500 voters will be older than 60. That’s almost three decades older than the average registered voter in Bloomington.
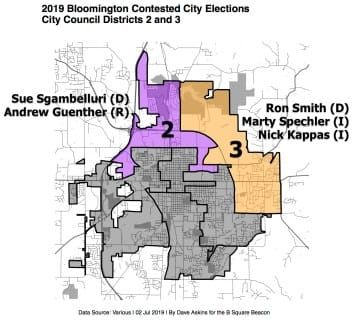
It’s unfair, of course, to compare an estimated maximum of 1,500 voters this November to the number of registered voters in all of Bloomington. That’s because elections will be held in just two of six city council districts this year. The other four district seats on the city council are uncontested. Also uncontested are races for all city-wide offices—mayor, city clerk and member-at-large city council seats.
Adjusting for just the roughly 16,000 registered voters in District 2 and District 3 combined, an estimated maximum turnout of 1,500 works out to around 9 percent. That doesn’t add up to a point of civic pride.
For District 2, my working estimate for maximum turnout is about 500 voters. I think if one of the two candidates gets more than 250 votes, that will be enough to win the seat. For District 3, I don’t think the turnout will be more than about 1,000 voters. I think if any of the three candidates gets more than 375 votes, that will be enough to win.
For both districts, I think the average age of voters this November will be older than 60.
After the jump, I’ll lay out the numbers behind those estimates.
Turnout: How many people are going to vote?
How many people are going to vote in District 2 and District 3 this year? Using past results as a guide is tricky, because this is the first year since at least 1967 that no elections for citywide offices have been held. Voters who might be drawn to the polls by a mayoral race might well stay home if “only” a city council seat is at stake.
To get some ballpark numbers, that could serve as upper bounds, I pulled the totals from the handwritten ledgers maintained by the Monroe County election staff for the last four November municipal elections in Bloomington.
The highest number of votes cast for a District 2 race for any of those years was 1,039 in 2003. The next cycle, in 2007, was a close race between Brad Wisler and Jillian Kinzie, but it drew about 150 fewer voters (890) than the race four years earlier. The 2007 race is the most recent contested election for the District 2 seat.
This year’s added wrinkle, of no mayoral or any citywide race, means the 890 votes in 2007 might be a more reasonable number to take as a guide for this November, instead of the higher total in 2003.
But I think we could see an even lower number.
Even though the District 2 council race in 2011 was uncontested, turnout in the district for other races that year might give some insight into this year’s race. That’s because the mayor’s race in 2011 was uncontested, just like this year. But the city-wide member-at-large council races featured five candidates for the three open slots.
So District 2 voters had a chance to cast ballots in those contested member-at-large races. In the member-at-large races that year, citizens in District 2 cast 1,382 votes in the vote-for-three scheme. That means 460 is a fair rough estimate for the number of District 2 citizens who voted in the member-at-large races in 2011.
If 2019 looks anything like 2011, maybe 500 people will show up to the polls in District 2—that’s erring on the optimistic side. That means 250 votes could win the District 2 race this year.
In District 3 the council seat was also uncontested in 2011. But if we look at member-at-large numbers, the 3,203 votes cast in those races by District 3 citizens work out to around 1,067 voters. That might be a more realistic figure than the 1,539 votes that were cast in the most recent District 3 race, a two-way contest between Allison Chopra and Nelson Shaffer.
This year’s three-way District 3 race does not appear to feature any candidate who can be dismissed as a factor—one is the Democratic Party nominee, another a former councilmember, and the third is a current plan commissioner. So I think a candidate who gets 37.5 percent of the votes could win. Applying 37.5 percent to a turnout of 1,000 people makes 375 votes a winning total in District 3.
District 2 Election History
| DATE | PARTY | CANDIDATE | Votes |
| 2003-11-04 | Dem | Susan Sandberg | 477 |
| Rep | Jason Banach | 562 | |
| TOTAL | 1,039 | ||
| 2007-11-06 | Dem | Jillian Kinzie | 441 |
| Rep | Brad Wisler | 449 | |
| TOTAL | 890 | ||
| 2011-11-08 | Dem | Dorothy Granger | 354 |
| Rep | 0 | ||
| TOTAL | 354 | ||
| 2015-11-03 | Dem | Dorothy Granger | 551 |
| Rep | 0 | ||
| TOTAL | 551 |
District 3 Election History
| DATE | PARTY | CANDIDATE | Votes |
| 2003-11-04 | Dem | Michael Diekhoff | 1,422 |
| Rep | John Hurlow | 917 | |
| TOTAL | 2,339 | ||
| 2007-11-06 | Dem | Mike Satterfield | 1377 |
| Rep | 0 | ||
| TOTAL | 1,377 | ||
| 2011-11-08 | Dem | Marty Spechler | 741 |
| Rep | 0 | ||
| TOTAL | 741 | ||
| 2015-11-03 | Dem | Allison M. Chopra | 1,110 |
| Rep | Nelson Shaffer | 429 | |
| TOTAL | 1,539 |
Older voters: More likely to vote than younger voters
Based on the voter history file provided to The Beacon by the county election supervisor’s office in early July, Monroe County voter participation echoes the national pattern. Younger registered voters are less likely to vote than older voters.
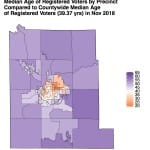
To illustrate this phenomenon in Monroe County, I plotted out on a map the median age of registered voters in the current file of voters for each precinct. The color of each precinct is based on how the median age of voters in that precinct compared to the median age of registered voters countywide (38.37) in November 2018.
From the first map, it’s clear registered voters inside the city of Bloomington are younger on average than registered voters elsewhere in the county. This is not a surprising fact, given the location of Indiana University in Bloomington. The median age of registered voters (in the July 2019 file) in November 2018 was 32.01 years in Bloomington, but 49.31 outside Bloomington.
For the second map, the median age was calculated for just those voters in the July 2019 voter file who participated in the November 2018 general election. Each precinct was shaded based on how the median age of election participants in that precinct compared to the median age of registered voters countywide. The second map illustrates that those who vote had a higher median age than registered voters overall: The second map is purpler than the first map.
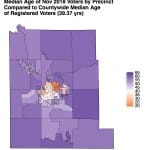
If we narrow our focus to just the city of Bloomington, the same phenomenon is evident for the mid-term election of 2018. Except for a couple of precincts that include parts of the university campus, those who voted in November 2018 were older on average than registered voters citywide.
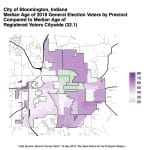
For recent municipal elections—primaries and general—the direction of the trend is the same, but its magnitude is startling. The difference between the median age of registered voters and the median age of those who voted in those elections can be as much as 30 or 40 years.
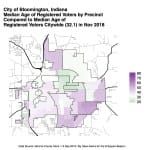
Illustrated in color, here’s what median ages for voters in the 2015 November municipal elections and this year’s 2019 primaries looked like when they were plotted against the median age of all registered voters:
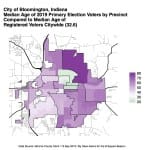
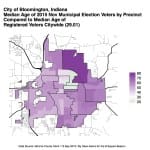
Grouping precincts by district, it’s possible to get a rough idea of the age of voters this year in Districts 2 and 3. The median age of registered voters in District 2 (as of July 2019) is about 26. But District 2 voters in the 2015 municipal election had a median age of almost 61 years.
In District 3, the median age of all registered voters is about 36. District 3 voters in the 2015 municipal election had a median age of about 64.
Here’s how the median ages break down by council district for three recent elections:
Median Ages
| District | Voted Muni Nov 2015 | All Reg Nov 2015 | DIFF (Nov 2015) | Voted Primary 2019 | All Reg May 2019 | DIFF (May 2019) | Voted Gen 2018 | All Reg Nov 2018 | DIFF (Nov 2018) |
| District 1 | 53.93 | 32.36 | 21.57 | 48.02 | 35.87 | 12.15 | 38.61 | 35.37 | 3.24 |
| District 2 | 60.88 | 22.79 | 38.09 | 62.46 | 26.29 | 36.17 | 25.47 | 25.80 | -0.33 |
| District 3 | 64.04 | 32.52 | 31.52 | 64.42 | 36.03 | 28.39 | 47.63 | 35.53 | 12.10 |
| District 4 | 61.63 | 34.88 | 26.75 | 63.44 | 38.39 | 25.05 | 49.15 | 37.89 | 11.27 |
| District 5 | 57.52 | 36.45 | 21.08 | 56.31 | 39.96 | 16.35 | 45.81 | 39.46 | 6.36 |
| District 6 | 53.83 | 22.13 | 31.70 | 45.28 | 25.64 | 19.65 | 22.75 | 25.14 | -2.39 |
| Citywide | 60.10 | 29.09 | 31.01 | 59.29 | 32.59 | 26.69 | 40.33 | 32.10 | 8.23 |
Based on past turnout, more than half of the voters who show up to vote in District 2 and District 3 this year will be older than 60.
Concluding Thought
My estimates of turnout could be too low. Maybe I am underestimating the interest that voters have in these city council races. I could also be overestimating the impact of the contested mayoral races in past years.
I have no doubt that many of the older voters who always show up for local elections will vote again in Districts 2 and 3 this year—even if it’s only out of habit and a sense of civic duty. But I wonder if some of those older voters will give the elections a pass this year.
For their younger counterparts I have hope, but not much faith, that this will be the year that their representation at the polls will match their distribution in the voting population. If a lot more voters show up to the polls in District 2 and District 3 than I have guessed, I think it will probably be because younger voters turn out in higher numbers than they typically do.
I would be delighted to be dramatically wrong about the turnout. Because that would mean that our local democracy is way healthier than I have pegged it to be.

Comments ()