Bloomington Transit bus ridership: Continued slide in 2018 with university affiliated ridership down 8 percent
Fresh numbers provided by Bloomington Transit show that total bus ridership last year dropped for the fourth year in a row. And the decrease was driven mostly by decreases in ridership by university affiliates—students and faculty.
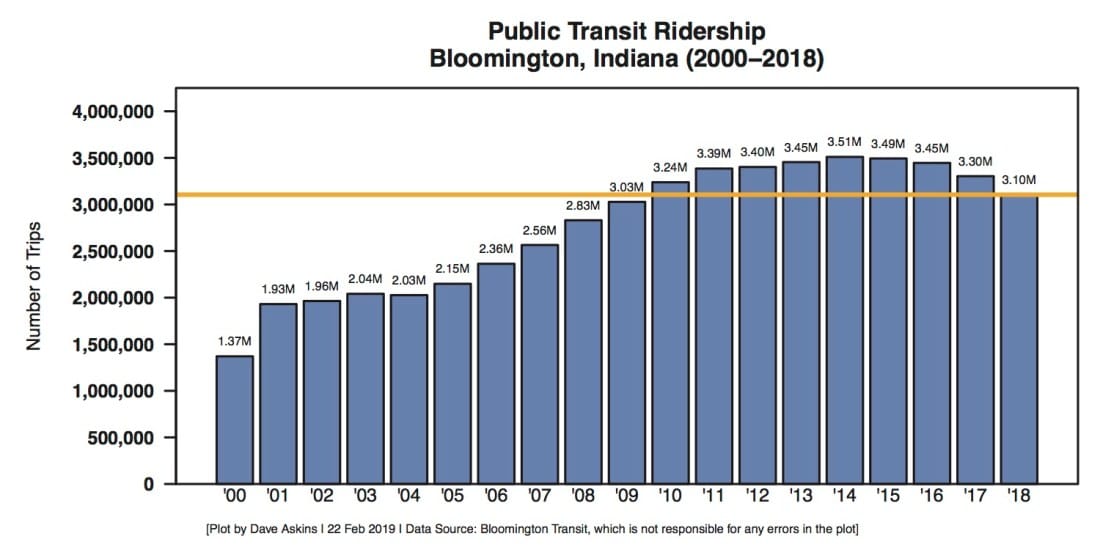
The roughly 3.1 million rides taken on Bloomington public buses in 2018—by university affiliates or rank-and-file resident riders—reflect a 6-percent decrease compared to the year before, and a 13-percent decrease compared to the peak of 3.51 million rides taken in 2014.
The recent four-year downward slide follows a few years of slowing growth and a plateau, after a 50-percent increase in ridership from 2005 to 2010.
Ridership in 2018 was the lowest in nearly a decade. The most recent year with lower ridership than in 2018 was 2009, when 3.03 million trips were taken.

The downward ridership trend for Bloomington Transit was noted at public meetings held last fall to gather input as part of a route optimization study that’s being conducted by Foursquare Integrated Transportation Planning, a consulting firm based in Rockville, Maryland. The scope of the Foursquare study includes the Indiana University bus system, which currently operates separately from the city’s buses.
At one of the public meetings held in mid-November 2018 at the Indiana Memorial Union, BT general manager Lew May said the declining ridership numbers were part of a national pattern.
The national trend was described in last year’s Federal Transit Administration’s summary report, which had come out a month earlier. The report drew on the latest numbers in the National Transit Database: From 2014 to 2017, total public transit passenger trips nationwide fell from 10.6 billion to 10.1 billion.
Even on Bloomington city buses, university-affiliates make up the dominant share of ridership. In 2018, university affiliates made up nearly three quarters (73.6 percent) of BT ridership. (University affiliates can board buses by showing a university credential, without paying a fare. BT drivers tally riders as they board.)

It’s the university-affiliate component of BT ridership that is showing a greater decline over the last couple years, compared to non-university ridership. University-affiliated ridership on BT buses dropped 8 percent from 2017 to 2018, and 5.3 percent from 2016 to 2017. Non-university ridership was off last year by just 0.1 percent compared to the year before, and just a half percent from 2016 to 2017.

It’s conceivable that some trips that students might have otherwise taken on a city bus were made instead aboard an electric scooter. How much of that 8-percent drop in IU-affiliated ridership might be blamed on the mid-September arrival of dockless electric scooters – Birds and Limes – in Bloomington?
The month-by-month numbers don’t seem to confirm a dramatic ridership decrease due to scooters.
Among students, September 2018 saw a 10.7-percent ridership drop compared to September 2017. However, four other months last year—before the scooters were deployed—also saw double-digit percentage decreases, compared to the same months the year before. March 2018 saw a 10.2-percent drop. May, June and July saw drops of 21 percent, 13.7 percent, and 19 percent, respectively.

Results of an non-scientific survey after the arrival of the scooters also don’t point clearly to a dramatic erosion of city bus ridership due to scooters. But the survey results suggest scooters could be chipping away at bus ridership. The scooter survey was conducted late last year by the city of Bloomington, using the Polco.us platform. The survey included this question:
If you have used a scooter, what form of transportation has your scooter ride most often replaced?
The majority of the 213 respondents (about 75 percent) had not used a scooter at all. Two percent of respondents—which translates to about 7 percent of scooter users—said a scooter most often replaced a trip made on a city or university bus.


Comments ()