Monroe County health department: Decision on extension of May 15 stay-at-home order to use science and data plus questions and reasoning
Based on Indiana governor Eric Holcomb’s “Back on Track” order issued on May 1, as soon as this Monday (May 11), it would have been possible to sit and drink a pint at restaurants in Bloomington and elsewhere in Monroe County.

The restaurants would have needed to limit the number of customers to 50 percent of capacity.
But on the same day that Holcomb announced his phased-in reopening plan, local officials announced an order from Monroe County’s health officer saying that conditions from the existing stay-at-home order would remain in place through May 15. That means for a little while longer, Monroe County residents will be eating and drinking at home.
How much longer? And when will a decision be made on a possible extension of the county’s order past May 15?
At last Friday’s press conference, county health administrator Penny Caudill said, “We can’t make it too early, but we do want to make it as early as we can, to give people a chance to plan. But we also have to follow the information and the data.”
Caudill said public health decisions are “based on science and data, but they’re not based on those things without questions and reasoning.”
County leaders have pointed to the Centers for Disease Control’s “gating criteria” as the benchmarks they’re using. Based on comments in several contexts last week, it’s apparent that the gating criteria aren’t being considered by local leaders as boxes to be checked off as satisfied once and for all, without subjecting them to additional review.
Last week, local leaders talked about the information they’re using to make decisions on re-opening—and it was subject of scrutiny.
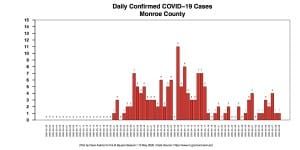
On Thursday, the Facebook page for the office of Bloomington’s mayor, John Hamilton, included a new post with a chart and a trend line to support a contention that COVID-19 cases are not on a downward trajectory in Monroe County.
The Facebook post stated, “As advised by the CDC and the White House, one of the criteria to open back up is a downward trajectory of documented cases…within a 14-day period among several other benchmarks. In actuality, cases in Monroe County are starting to plateau and are not declining yet. The trend line graph below illustrates that.”
By the following afternoon, at the regular weekly press conference of local leaders on COVID-19 issues, Bloomington’s mayor John Hamilton, and Caudill, the health administrator, were walking back the use of the chart in that context.
The chart showed cumulative cases, which mathematically could never show a downward trend. Asked at Friday’s press conference if he could clarify matters by rejecting the use of a cumulative chart to demonstrate the lack of a downward trend, Hamilton said, “I agree with you in the sense that…the angle can never go downward.”
Caudill said, “So there are multiple graphs—that may have not been the best one to send that way.”
The “downward trajectory” phrasing from the CDC gating criteria is part of an either-or gating criteria pair that involves COVID-19 cases:
CASES
Downward trajectory of documented cases within a 14-day period
OR
Downward trajectory of positive tests as a percent of total tests within a 14-day period (flat or increasing volume of tests)
A chart of new daily cases, based on numbers from Indiana State Department of Health’s dashboard, shows a possible break after April 17, with fewer cases after that point.

At Wednesday’s county commissioners meeting Caudill described the number of recent cases as “rather steady,” noting that some days there are no cases, and others with two or three. On Friday, Caudill said, “What we’re looking for is really the leveling off on the number of cases as they’re coming in, and then a decline.”
About the more recent couple weeks worth of data, Caudill said, “We don’t have really huge numbers, and that’s a good thing, but it also can make those daily graphs and things a little more difficult to look at.”
At Friday’s press conference, Caudill confirmed that the small number of cases is part of the reason 14-day averages aren’t analyzed as proving a kind of downward trajectory that settles the question once and for all. On Friday, the last six weeks worth of daily averages for 14-day periods in succession were: 4.29, followed by 3.14 and then by 1.64 average confirmed cases per day.
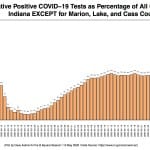
The other part of the “cases” CDC gating criterion involves the percentage of tests that are positive, assuming the number of tests is flat or increasing. The percentage of positive tests is supposed to be on a downward trajectory, according to the gating criteria.
On that score, Caudill confirmed that Monroe County is headed in the right direction. But she wants to see that trend continue: “That’s actually an area where we have been doing very well we have seen a recent small decline and we want to continue to see that, ideally.”
In mid-April the cumulative percentage of positive tests in Monroe County peaked at around 13 percent. As of Sunday that figure stood at 8 percent.

Caudill is keen to see what happens to testing numbers, case numbers, and the percentage of positives, when additional testing capacity is made available on Wednesday or Thursday next week by OptumServe Health Services. That will make available as many as 132 tests a day. Up to now, Monroe County has ranged between 30 and 60 tests a day.
Eligibility guidelines for the OptumServe tests, Caudill said on Friday, have loosened up. People in high-risk groups—65 and over, with chronic diseases such as diabetes, or high blood pressure, and other underlying medical conditions—will be able to get tested, even if they are not symptomatic, she said.
Caudill said that even with additional testing capacity, the number of tests might not go up—if people have been listening to advice, given up to now, to stay home, isolate and call their health care provider, but not necessarily to try to venture out to find a way to get tested.
Caudill said she thinks the number of cases will go up with increased testing capacity, but she’ll also be looking at the percentage of tests that are positive.
Testing is part of the “hospitals” gating criteria put out by the CDC:
HOSPITALS
Treat all patients without crisis care
AND
Robust testing program in place for at-risk healthcare workers, including emerging antibody testing
The ability of hospitals to treat all patients without using a crisis standard of care means that patients can be treated without a substantial change in usual healthcare operations.
That’s a gating criterion that appears to be satisfied for Monroe County and most of the rest of the state. It’s related to the daily hospitalization numbers that the governor’s team has weighted heavily, along with open ICU beds and available ventilators, as justification for Holcomb’s reopening plan.
From the state’s Sunday dashboard figures, 81 percent of the state’s 3,078 ventilators are available, and 42 percent of the state’s 2,675 ICU beds are available.
At Friday’s press conference, Brian Shockney, who’s president of IU Health’s South Central Region, discounted the idea that daily hospitalization numbers are an indicator of COVID-19’s prevalence. Hospitalization numbers are “only an indicator of the severity and the overwhelming of hospital operations,” he said, adding that it is “not an indication of the prevalence of the virus in our community, so we just want to be sure that everyone understands that as we make decisions.”
During the press conference, Shockney also showed a chart of combined COVID-19 patient census numbers for IU Health and Monroe Hospital.

When the governor made his decision on May 1, Shockney said, “If we had another surge we would not be able to handle it. So we gave that information to the local officials and health department and we believe the right decision was made.”
Asked later by The Square Beacon for the numerical scale of the chart’s Y axis, in an email message, Shockney said, “We do not give out numbers on the Y axis as those numbers are a combination of Monroe and IU Health. … Therefore, this is our trend line of truly COVID-19 patients that occupy beds in our hospitals here—depicting the severity of the virus in our community.”
It’s the trend, not the numbers, that is given to the county health department a piece of data for making decisions, Shockney said. Shockney also clarified that the graph he showed did not include those patients in beds who were waiting for COVID-19 test results.
Daily Cases and Percentage Positive Cases: Statewide vs. Monroe County


Comments ()