Pandemic notebook: Adjusted daily data shows downward (and upward) trends a smidgen earlier


Numbers reported in all categories related to the COVID-19 pandemic continue to decline.
A change to the way the state of Indiana is reporting daily case totals hasn’t changed the shape of the trends.
At Friday’s every-other-week news conference of local leaders, IU Health community relations director Shawna Girgis reported a drop in the health provider’s inpatient numbers. It’s a sufficient decrease to allow IU Health to start tackling the backlog of elective surgeries, Girgis said.
Indiana governor Eric Holcomb’s emergency health order expires on March 4, and it’s not expected to be extended. With the expiration of the governor’s order, Monroe County’s mask mandate will also expire, and the county board of health is not expected to take action on its own to try to extend a mask mandate.
About the end of the indoor mask mandate, Girgis said, “I’m sure I’m not the only person who’s excited to take this step toward our new normal.”
Girgis added, “As a reminder, we encourage individuals to wear masks as they feel comfortable. We also encourage you to wear a mask if you’ve felt sick, if you tested positive for COVID 19, and aren’t yet through your quarantine time, or if you’ve been in direct contact with someone who has recently tested positive for COVID-19.”
On Wednesday, a note on Indiana’s state dashboard quietly announced a change to the way daily positive case data is analyzed: “IDOH is now displaying cases by day by the date that the positive test was collected.”
It’s the same approach that has been used all along for reporting of pandemic deaths. On any given day, the bar charts for the number of “new deaths” have visibly allocated those numbers to the actual date of the death.
In the past, at least some instances of positive tests were handled that way. That is, some of the positive tests were allocated to the date when the specimen was collected. Based on the dashboard note, they’re now all being handled that way.
For example, on Friday’s dashboard, the 19 newly reported positive cases for Monroe County were sprinkled across several dates, the earliest one on Jan. 10.
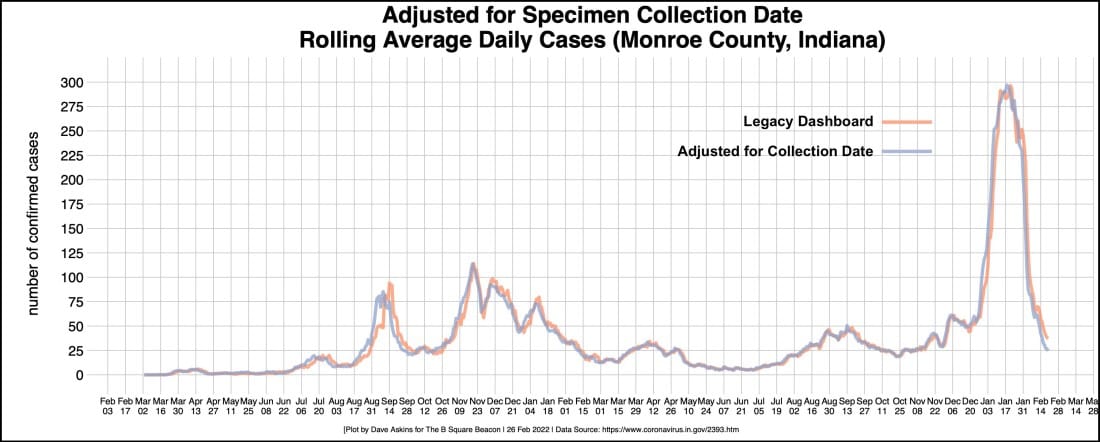
The B Square compared the daily case data provided historically by the state’s health department, since the start of the pandemic, to the data now provided with the “date collected” approach.
From March 2020, there are some big differences between the datasets in the numbers for individual dates—a couple of hundred cases for some days. But it’s pretty much the same picture when the rolling 7-day average is computed for both datasets and plotted out.
The approach that ties the numbers to the date when a positive test specimen was collected shows the trends taking shape a couple days earlier. But the trends have about the same duration and scale.
As the two-year anniversary of the pandemic approaches, news outlets will likely mark that milestone by measuring from the “first positive case” in a geographic area.
For Monroe County, that date, as reflected in the newest dataset, is March 13, 2020.
In the legacy dataset, the first date for a positive case in Monroe County was a week later, on March 21, 2020.


Comments ()