Pandemic notebook: Declining case numbers give momentum for lifting restrictions

The Monday update to Indiana’s COVID-19 data dashboard confirmed the trend in declining positive case numbers and hospital census statewide.
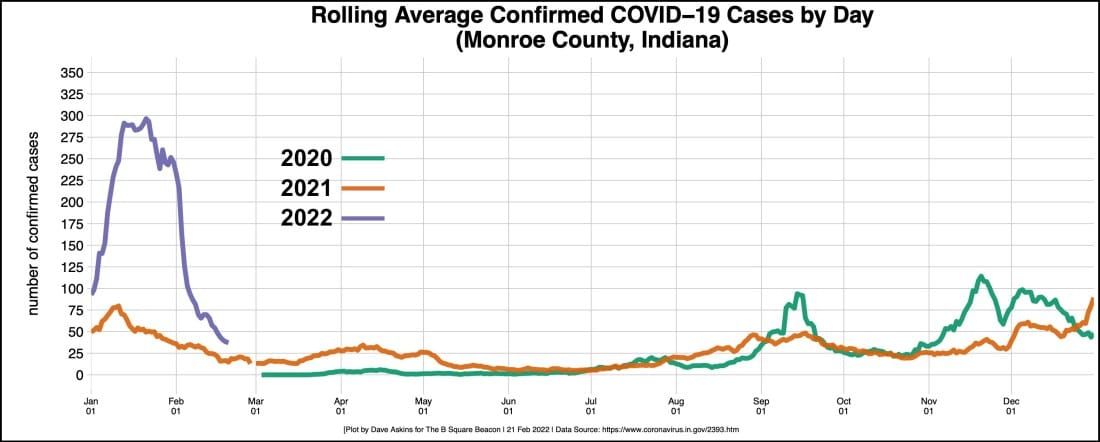
Also in Monroe County the downward trend continued, as the rolling daily average of positive cases dropped to 37. That’s still about twice the rolling average at this same time last year. But it’s just one-eighth the rolling average posted by Monroe County a month ago, on Jan. 21.
Hospitalizations statewide are down, too. The statewide hospital census of COVID-19 patients now stands at 1,093. That’s less than a third of the peak number on Jan. 13, which was 3,519.
It’s a similar picture for Hospital District 8, which includes Monroe County. The District 8 COVID-19 census is now 64 patients compared to 171 a month ago. Besides Monroe County, District 8 includes Brown, Bartholomew, Lawrence, Jackson, Orange, and Washington counties.
The improving trends after the surge, caused by the Omicron variant of the virus, has helped add momentum to sentiment in favor of lifting of various restrictions.
It’s not certain, but among B Square sources, Indiana governor Eric Holcomb is not expected to extend his current emergency order, which currently is set to expire on March 4.
Indiana University has announced that wearing a mask indoors on campus will become optional, starting March 4.
At its most recent meeting, the Monroe County board of health appeared content to allow the county’s indoor masking mandate expire with the governor’s order. But the board of health has a meeting set for March 3, one day ahead of the date when the governor’s order is set to expire.
Previously, the county board had tied the lifting of the mask mandate to achievement of certain metrics on community disease spread, reflected in the state’s color coded system for each county. This week’s numbers will improve Monroe County’s color-coding from red to orange, when the color-coding update is announced on Wednesday. The next two (better) colors are yellow and blue.
The two metrics are positivity rate and number of weekly cases per 100,000 residents.
The county’s 7-day positivity test average stands at 10.1 percent, which is just a smidgen over the 10-percent threshold that defines a yellow score.
The county’s total number of cases for the last week was 261, which translates to 176 per 100,000 county residents. That puts the county still squarely in the orange category which is defined by 100 to 199 cases per 100,000 residents.
On Feb. 14 and 15, Monroe County recorded 50 and 72 cases, respectively. Over the next two days, those higher numbers will drop out of the rolling 7-day average. If the county maintains the most recent 5-day average for the next two days, the rolling average will drop from 36 to 28.


Comments ()