Second snow of 2019 gets more complaints than first
Bloomington has seen two snowfalls that delivered significant accumulations so far in 2019. A storm that moved through central Indiana from Jan. 11–12 dumped about 4 inches. The second snow started in the early evening of Saturday, Jan. 17 and left Bloomington swaddled in a 5-inch frigid blanket.
The first snow didn’t generate much activity in the city’s uReport system, which gives residents a way to log complaints about any topic, not just snow on sidewalks and streets. Just a half dozen complaints were filed in the uReport system, like this one on Jan. 15:
Sidewalks along south side of Moores Pike, Shadow Creek neighborhood, never seem to be cleared.
The second snowfall generated at least 37 requests in the uReport system, some of which included compliments along with a complaint, like this one on Jan. 20:
The plow drivers did an excellent job clearing Creekside CT. Unfortunately they put all of that snow from Creekside CT 3ft high and 4ft deep in my driveway across the street at 3707 E Winston St. In the future can this be avoided?
The colder temperatures, combined with the Martin Luther King Jr. holiday on Monday, could have contributed to the less successful snow clearing effort. According to the official City of Bloomington Twitter account, “We reached out to our Housing & Neighborhood Dev Dept (HAND) to inquire about their task of monitoring sidewalk snow removal. HAND stated that extreme weather/temps + the holiday weekend/lack of resources worked to delay their team.”
Also according to the city, when the residents sent the city complaints using social media, the report gets logged into the uReport system: “We create uReports for non-emergency issues that are reported to us via social while at the same time, encouraging folks to log their own reports in the future.”
An example of that city’s use of social media to log uReports appears to be a record that was created on Jan. 22: “Twitter user Tagged City of Bloomington: North Walnut St. before you get on to 69N is pretty bad.”
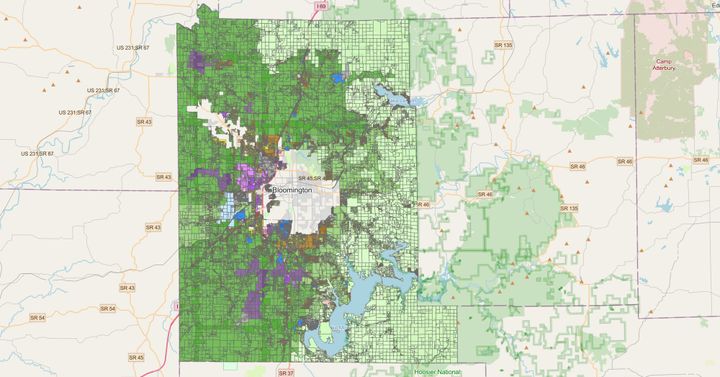
The Open311 dataset that the city updates daily on its website includes latitude and longitude information. Here’s a plot of snow-related complaints so far in 2019, pulled from that dataset. (The map is interactive; mouse over or click on a dot and a little text window pops up with a description of the complaint.)

Comments ()