Survey: Bloomington renters more likely than homeowners to favor supportive housing for the homeless; overall trend upward
Statistically speaking, Bloomington’s renters are significantly more likely than the city’s homeowners to favor the provision of supportive housing to those who are experiencing homelessness.

That’s according to results from a community survey done by Polco’s National Research Center (NRC), Inc..
Survey results were presented to Bloomington’s city council at its regular Wednesday meeting.
Of renters who responded to the survey, 99 percent said that they strongly or somewhat support providing assistance in the form of supportive housing.
At 88 percent, a clear majority of homeowners also favor such support, but the 11-point difference is significant, according to NRC.
That’s one of the nuggets that comes to the surface when the survey results are parsed into a spreadsheet that can be sorted and filtered for the statistically significant differences in demographic categories—like homeownership, time of residency, student status, gender, and age.
The demographic breakdowns were not a highlight of the presentation given to the city council by Damema Mann, who is director of national engagement for NRC Polco.
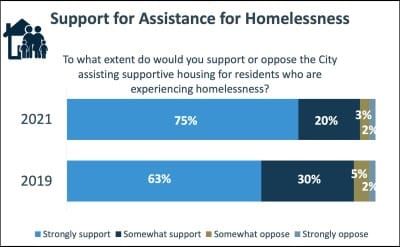
Highlighted on one of Mann’s slides was the 12-point increase in favor of the city giving housing assistance to those experiencing homelessness. In 2019, 63 percent of respondents said they were strongly in favor of supportive housing, compared to 75 percent in 2021.
The percentage of respondents who said homelessness is a challenge for Bloomington increased by 18 points, from 56 percent in 2019 to 74 percent in 2021.
Downward trends over time for some ratings, like those for quality of police services, also made their way into Mann’s slide deck.
In Bloomington’s 2017 survey, 78 percent of respondents rated police services as good or excellent. That figure dropped 18 points for the 2021 survey—just 60 percent gave police services one of the two highest marks.
Between 2017 and 2021, positive ratings of resident interactions with the Bloomington police department dropped 12 points, from 54 to 42 percent.
Another place where Bloomington’s ratings have slipped is the perception of overall services provided by Bloomington’s city government. In 2017, 80 percent of respondents rated overall services as good or excellent, compared to 73 percent percent for the 2021 survey.
Not all the findings were negative. Mann led off with some of the generally high marks Bloomington got in the results. About 79% of survey respondents gave Bloomington good or excellent marks for overall quality of life. That’s a number that is about the same as national and peer benchmark communities, Mann said.
At least three-quarters of survey respondents gave Bloomington high marks for quality of life, as a place to live, as a place to visit, as a place to raise children, and to their own neighborhoods, Mann reported. And those are results that are stable over time.
This is the third year the city has contracted with NRC for the survey, which is done every two years. Bloomington’s first NRC survey was done in 2017.
This year’s survey was done during the last week of March. A random sample of 3,000 households inside Bloomington city limits were sent a survey, Mann told the council. The 527 completed surveys make for a response rate of 19 percent, which is average for this kind of study, Mann said.
Bloomington’s 2019 survey had a response rate of 21 percent, according to a news release.
Some of the survey results probably confirmed numerically common perceptions. During the pandemic, the use of a video-conference platform called Zoom has led to a sense by many that civic participation through attendance at government meetings has increased.
In 2021, 36 percent of respondents said they had watched (online or on television) a local public meeting. That was up 9 points, from 27 percent in 2019, and up 15 points from 21 percent in 2017.
Bloomington’s farmers market, which was embroiled in controversy during the 2019 season, over white supremacist vendors at the market, saw a 19-point drop in rating of quality from 2017 to 2021. In 2017, 90 percent of respondents rated the city’s farmers market as excellent or good, compared to 71 percent of respondents in 2021.
The farmers market’s 19-point drop was the second biggest rating slide among items where there was a difference over time. Dropping 20 points was the rating for ”openness and acceptance of the community toward people of diverse backgrounds.” In 2017, 79 percent of respondents rated Bloomington’s openness as excellent or good, compared to 59 percent in 2021.
The tables below are a sampling of the kind of sorting that can be done using the B Square Google Sheet into which some of the survey results have been parsed. [Shared Google Sheet] (NRC flags statistically significant differences with letter codes like A and B.)
Table: Bloomington Renters Higher than Owners
| What is tallied | Concept to be rated | Rent (A) | Own (B) | RENT OWN DIFF |
| at least once in past 12 mos | Used bus or other public transportation instead of driving | 41% B | 17% | 24 |
| at least once in past 12 mos | Carpooled with other adults or children instead of driving alone | 61% B | 38% | 23 |
| at least once in the past 12 mos | Walked or biked instead of driving | 85% B | 71% | 14 |
| excellent/good | The City of Bloomington (quality of services provided by government) | 77% B | 65% | 12 |
| strongly or somewhat support | To what extent would you support or oppose the City assisting supportive housing for residents who are experiencing homelessness? | 99% B | 88% | 11 |
| excellent/good | Shopping opportunities downtown | 62% B | 52% | 10 |
Table: Bloomington Owners Significantly Higher than Renters
| What is tallied | Concept to be rated | Rent (A) | Own (B) | OWN RENT DIFF |
| excellent/good | Resident interaction with the Bloomington Police Department | 27% | 68% A | 41 |
| very/somewhat likely | Remain in Bloomington for the next 5 years | 46% | 86% A | 40 |
| excellent/good | Recycling | 50% | 85% A | 35 |
| at least once in the past 12 mos | Done a favor for a neighbor | 53% | 87% A | 34 |
| at least once in the past 12 mos | Talked to or visited with your immediate neighbors | 63% | 95% A | 32 |
| essential/very important | Garbage collection | 48% | 79% A | 31 |
| essential/very important | Sewer services | 57% | 87% A | 30 |
| excellent/good | Yard waste pick-up | 57% | 86% A | 29 |
| essential/very important | Storm drainage | 54% | 83% A | 29 |
| excellent/good | Overall impression (city staff) | 51% | 80% A | 29 |
| excellent/good | Police services | 49% | 77% A | 28 |
| essential/very important | Fall leaf pick-up | 30% | 56% A | 26 |
| excellent/good | Bloomington as a place to retire | 58% | 82% A | 24 |
| at least once in the past 12 mos | Voted in your most recent local election | 69% | 93% A | 24 |
| excellent/good | Responsive (city staff) | 54% | 78% A | 24 |
Table: Bloomington’s 10 Biggest Drops from 2017 to 2021
| Type of Rating | Concept to be rated | 2021 (%) | 2019 (%) | 2017 (%) |
| excellent or good | Openness and acceptance of the community toward people of diverse backgrounds | 59 | 81 | 79 |
| excellent or good | Farmers market | 71 | 91 | 90 |
| excellent or good | Police services | 60 | 83 | 78 |
| excellent or good | Variety of housing options | 40 | 48 | 54 |
| excellent or good | Overall development of a variety of housing options in downtown (i.e., townhomes, apartments, etc.) | 32 | 44 | 46 |
| excellent or good | Availability of affordable housing options | 20 | 27 | 34 |
| excellent or good | Parking garages | 52 | 47 | 64 |
| excellent or good | Resident interaction with the Bloomington Police Department | 42 | 57 | 54 |
| excellent or good | Cost of living in Bloomington | 33 | 43 | 44 |
| excellent or good | Land use, planning, and zoning | 39 | 47 | 50 |
Table: Bloomington’s 10 Biggest Gains from 2017 to 2021
| Type of Rating | Concept to be rated | 2021 (%) | 2019 (%) | 2017 (%) |
| excellent or good | Employment opportunities | 50 | 46 | 43 |
| excellent or good | Drinking water | 66 | 64 | 59 |
| excellent or good | Street lighting | 55 | 49 | 48 |
| excellent or good | Public places where people want to spend time | 76 | 72 | 70 |
| excellent or good | Open space (green space) | 75 | 66 | 69 |
| excellent or good | Garbage collection | 83 | 84 | 78 |
| excellent or good | K-12 education | 80 | 78 | 76 |
| excellent or good | Fourth Street Arts Fair | 86 | 85 | 82 |
| excellent or good | Fitness opportunities | 83 | 78 | 80 |
| excellent or good | Yard waste pick-up | 72 | 74 | 69 |

Comments ()