New report: Bloomington’s 2018 GHG emissions up compared to 2016, but asterisks abound


On Tuesday night, Bloomington’s department of economic and sustainable development released a new report on greenhouse gas emissions. Based on data presented in the report, citywide numbers for the gases that are causing climate change have gone up by at least 12 percent since the last inventory was taken two years ago.
But the new report is hedged with caveats throughout, cautioning against comparing figures from the two reports, because of changes in methodology between the two years.
The previous inventory was based on 2016 data.
The new report, which is based on 2018 data, says that Bloomington generated community-wide 1,639,657 metric tons of carbon-dioxide equivalent emissions that year. That compares to 1,375,237 metric tons reported for 2016.
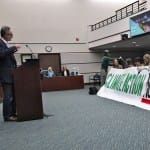
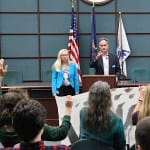
During Tuesday night’s presentation of the new report at city hall, Alex Crowley, director of the city’s department of economic and sustainable development, said the focus now would be on comparing future years with the numbers in the report released Tuesday. He also said a retroactive effort would be made to compute the inventory for the previous report using the current methodology.
To some extent, the new report already tries to adjust figures from the 2016 report.
The total emissions number reported by Bloomington in 2016 was 1,375,237 metric tons of carbon-dioxide equivalent. But after adjusting for methodology in the solid waste sector, the report released on Tuesday would put the 2016 solid waste number at 132,400 metric tons, instead of the 47,214 tons that was previously reported. That adjustment puts the emissions total for 2016 at 1,460,422 metric tons.
Compared to the solid-waste-adjusted total number from 2016, the 2018 number of 1,639,657 metric tons is 12 percent higher. The 2018 figure is 19 percent higher, if based on the unadjusted solid waste figure from 2016.
One of the caveats in the report about comparing the inventories from different years states: “[I]t would be difficult and erroneous to make conclusive comparisons … since they did not follow the exact same protocol and calculation methods.”
A significant difference in methodology used in the new report released on Tuesday, compared to the inventory done on 2016 data, is evident in the transportation sector.
In both years, the calculation for the transportation sector was based in part on vehicle-miles-traveled (VMT) data, which was collected from the Indiana Department of Transportation (INDOT). But in 2016, the calculation of emissions did not include VMT for all streets in Bloomington, or I-69/37, or aviation data.
For the 2016 inventory, Bloomington’s transportation sector generated 116,790 metric tons of carbon-dioxide equivalent, compared to the 443,554 metric tons measured for 2018.
A couple of categories that contributed to the 2018 total were not measured at all in 2016: “upstream impacts of activities” and “water and wastewater”.
For both inventories, the energy sector makes up the largest portion—more that half—of Bloomington’s carbon emissions. That means the way a company like Duke Energy generates its electricity has a significant impact on Bloomington’s greenhouse gas inventory. That’s incorporated into the calculations for the inventory through the Environmental Protection Agency’s eGrid.
Frustration at the lack of clear progress demonstrated by the report was expressed by several people in the audience on Tuesday, including by Ross Martinie Eiler. Bloomington needs to be showing reductions of around 7 percent or more every year to achieve its stated goals, Eiler said.
Crowley responded by citing Duke Energy’s goals to achieve Net Zero carbon emissions by 2050. As Duke takes coal-fired plants offline, Crowley said, that will lead to decreases that are stair-step in character, instead of incremental decreases in carbon emissions every year.
The decommissioning of coal-fired plants is part of the current rate case that Duke Energy is currently pursuing in Indiana. If Duke’s proposal is approved it would mean about a 19 percent rate hike over two years for residential customers.
Bloomington’s assistant director of sustainability, Lauren Travis, indicated to The Beacon last week that Bloomington does not have an official position on Duke Energy’s rate case, but wrote in response to an emailed question that “it is important to have a working relationship with Duke to advocate for providing greener power options for Bloomingtonians.” Duke provided utility-level data that was used to complete the 2018 inventory, Travis said.
The 2018 inventory was done based on the Global Protocol for Community-Scale Greenhouse Gas Emissions (GPC). Savannah Rodrigue, a master’s degree student at Indiana University’s School of Public and Environ, did much of the work on the new report and who delivered part of the presentation on Tuesday night.
Here’s a table of comparisons across sectors from the 2016 and 2018 reports, based in part on a table in the 2018 report:
| Sector | C02e 2018 (MT) | C02e 2016 (MT) | Note |
| Transportation & Mobile Sources | 443,554 | 116,790* | (did not include all roads in Bloomington, I-69/37 or aviation data) |
| Energy | 1,012,815 | 1,164,605* | (different eGrid values) |
| Residential Energy | 382,952 | 386,014* | |
| Commercial Energy | 273,062 | 287,048* | |
| Industrial Energy | 183,959 | 110,695* | |
| Government Energy* Includes City and County | 167,132 | Not disaggregated | |
| Unknown Energy | 5,710 | Not disaggregated | |
| Solid Waste | 130,820 | 132,400* | (adjusted to 2018 method) |
| Upstream Impacts of Activities | 33,652 | Not measured | |
| Water & Wastewater | 15,610 | Not measured | |
| Process & Fugitive Emissions | 3,206 | 46,627* | (inaccurate) |
Audience Reaction
In the front row for the presentation at city hall on Tuesday were a half dozen people holding a large banner, that read “Climate Action NOW.” They were led by Indiana University student and climate strike organizer Eliza Dowd. They set up by walking the banner from the second row out to the front row, before the presentation started.
Generally, the initial reaction to the report and the responses given by Crowley and Travis to questions was friendly in tone, but grew a little frustrated by the end.
Ross Martinie Eiler led off his remarks by telling the presenters: “I know you’re working so hard, you’re busting your butts and doing everything you can with not enough power and not enough resources given to you, so I really thank you for that.” He wanted to know if they saw any reason to think that Bloomington was on a downward trend for carbon emissions more than 2 percent a year.
In her response, Travis focussed on the fact that the picture is somewhat unclear, given the difference in methodologies. Eiler followed up: “What would you say to citizens of Bloomington who say we’re not even in the ballpark?”
Travis led off her reply by saying, “We have work to do.” She pointed to all sectors that need work, stressing energy efficiency and transportation as areas that the city would be working on in the coming year.
Mark Stosberg, who’s a member of Bloomington’s bicycle and pedestrian safety commission, contrasted the city’s planned investments in parking structures—around $50 million for two different structures—with the city’s budget for bicycle and pedestrian infrastructure, which he pegged at around $500,000 a year. Stosberg wanted to know if Crowley thought the new report would start shaping the city’s policy “on the ground” for budget actions. Crowley thought it would.
Following up on Stosberg’s description of investments in car infrastructure, Daniel Bingham added roughly $30 million for the new expanded convention convention center to the equation. The expanded convention center would rely crucially on aviation travel by conventioneers, he said. The center itself was planned to have yet another parking garage, Bingham said. That meant the city was investing between $80 million and $100 million in carbon-intensive transportation infrastructure.
Bingham said he did not see any indication the city was planning to take surface parking parking lots off line—which was a response to an earlier comment by Crowley that “stacked parking” (i.e., multiple-floor garages) should be the last kind of parking to remain in Bloomington.
Crowley responded by saying that the convention center expansion was planned for a surface parking lot. Surface parking lots would wind up being developed, Crowley said, not necessarily because the city government did it in a systematic way, citing the lot next to the CVS, across the street from the Buskirk-Chumley Theater as an example. (The lot has a sign indicating a future residential project.) On the topic of the convention center, Crowley said Bloomington relies on tourism dollars, and that has to be balanced with sustainability efforts.
Following up on the topic of the expanded convention center, Matt Flaherty suggested that it could be built as a Net Zero facility, which meant it should not be connected to natural gas. Flaherty will have a chance to influence that kind of decision next year, because he will be declared the winner of a city council seat by default after Nov. 5, because all the at-large council seats are uncontested and no elections are being held.
The lack of elections this year in four out of six city council districts is one of the reasons Randy Paul has started up a local caucus of the Green Party, which is now working to gain recognition by the party’s state level organization. Paul attended the presentation on Tuesday night and talked about parking and transportation.
Paul relies on Bloomington Transit for all his transportation, he said on Tuesday. But the stigma of public transportation is a barrier to increased ridership, he said. You could park a public bus in front of everyone’s house, but they’d still drive their car, he said, unless there’s a disincentive to drive. That’s why ridership on public buses increases when gas prices go up, he said. What’s needed is less parking, so that people have a disincentive to drive, he said.
Paul questioned whether the Bloomington’s elected leaders have the courage to make the policy choices that will lead to reduced greenhouse gas emissions.
Click to view slideshow.
Comments ()