Bloomington city council redistricting notebook: What might have been 10 years ago?

Bloomington’s redistricting advisory commission will meet for a second time on Monday (July 25), in the McCloskey Room at city hall, starting at 7:30 p.m.
To preview the commission’s meeting, The B Square took a look back to the council’s work a decade ago, which is the last time the city council districts were redrawn.
The boundaries have to be reconsidered every 10 years in the context of the decennial census. If the census shows that the populations of the districts are out of kilter, the boundaries are supposed to be redrawn to balance things out.
Ten years ago, it was the at-large councilmembers who formed a committee to review potential new maps. That means it was Andy Ruff, Timothy Mayer and Susan Sandberg who confronted the redistricting task.
The map that was adopted in 2012 served to define the council districts for the 2015 and 2019 municipal elections. Whatever map the council adopts this year, sometime before Dec. 31, will serve as the district map for the 2023 elections.
The B Square was able to locate online some records of those meetings. Those records show that the committee considered several possible maps, other than the one that was eventually adopted by the council that year.
At least two key concepts for redistricting are mentioned in the meeting notes.
One is the notion of population “variance” across districts. The idea is that every district should have about the same population, and a collection of districts that varies less from the ideal makes for a better map than a bunch of districts that varies more.
The other idea that gets a mention in the meeting notes is “compactness.” The idea is that geometric shapes are favored, if they make some kind of natural-looking clump, without a bunch of tendrils shooting off from a central area. One way of talking about compactness is to consider the perimeter compared to the total area. Does the shape of a district efficiently use the length of its perimeter to encompass an area on the map?
There’s a contrast in the meeting notes between mentions of “variance” and “compactness.”
Variance is mentioned in the context of some specific computation. Various map alternatives are listed out in the notes with their associated variances, expressed as percentages. A rule of thumb is that variance should be less than 10 percent. (The maps themselves are not included in the set of notes that were located by The B Square.)
But in the meeting notes, there’s no objective calculation of compactness for any of the map alternatives. The note from the Nov. 8, 2012 meeting is typical: “The plans were discussed, considering the merits of each in compactness, contiguity and equality of population.”
The formula for calculating “variance” in this context is straightforward arithmetic. Take the maximum population of any district, subtract the minimum population of any district, and divide the result by the “ideal” population of a district. The ideal population is the one you get by taking the total population and dividing by 6.
Calculating compactness is somewhat more complicated, partly because there’s not necessarily one agreed-upon best way to do it. One way to calculate compactness is to tie it to an area-to-perimeter ratio. On that approach, here’s one way to calculate compactness, which gives a number between 0 and 1:
Compactness = 4*π*AREA/PERIMETER2
A district that is long and skinny will have compactness close to zero. A district that is a perfect circle will have compactness equal to 1. To see how circles work out to perfectly compact districts, consider that for a circle with radius = 1, the area is given by π*r2 which is π*1 or just π.
The perimeter of a circle with radius =1 (aka circumference) is given by 2*π*r, which is just 2*π.
So the compactness of a circle with radius = 1 can be computed by substituting the area and perimeter of a circle with radius = 1 into the formula for compactness:
4*π*π/(2*π)2
That reduces to:
4*π2/4*π2 = 1
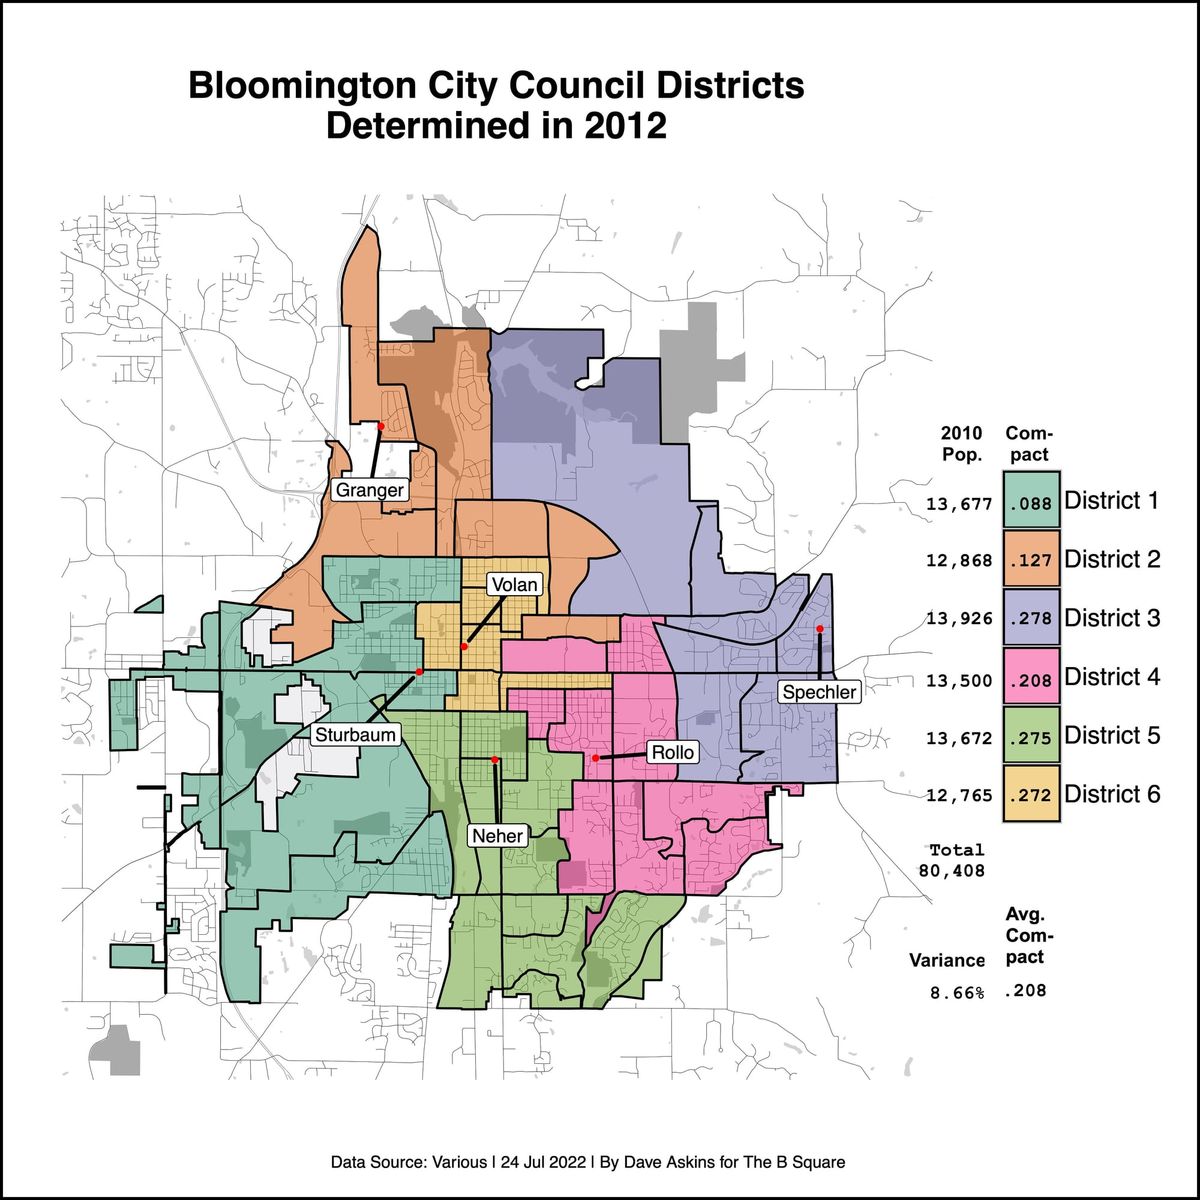
Could the city council of 2012 have adopted a different map that was better balanced than the one it did adopt? Yes. From the committee meeting notes, it’s clear that at least some of the maps that were considered had better than the 8.66-percent variance of the districts in the adopted map.
But what did those other maps look like? Did any of them have more compact districts as determined by some objective measure of compactness? [Added July 25, 2022 at 1:10 p.m. Based on a reliable tip from a reader that the maps from 2012 might have been preserved, The B Square reached out to city council office staff, which sent several maps by emailed attachment. The B Square has created a stand-alone page to host those maps: 2012 Bloomington city council redistricting maps]
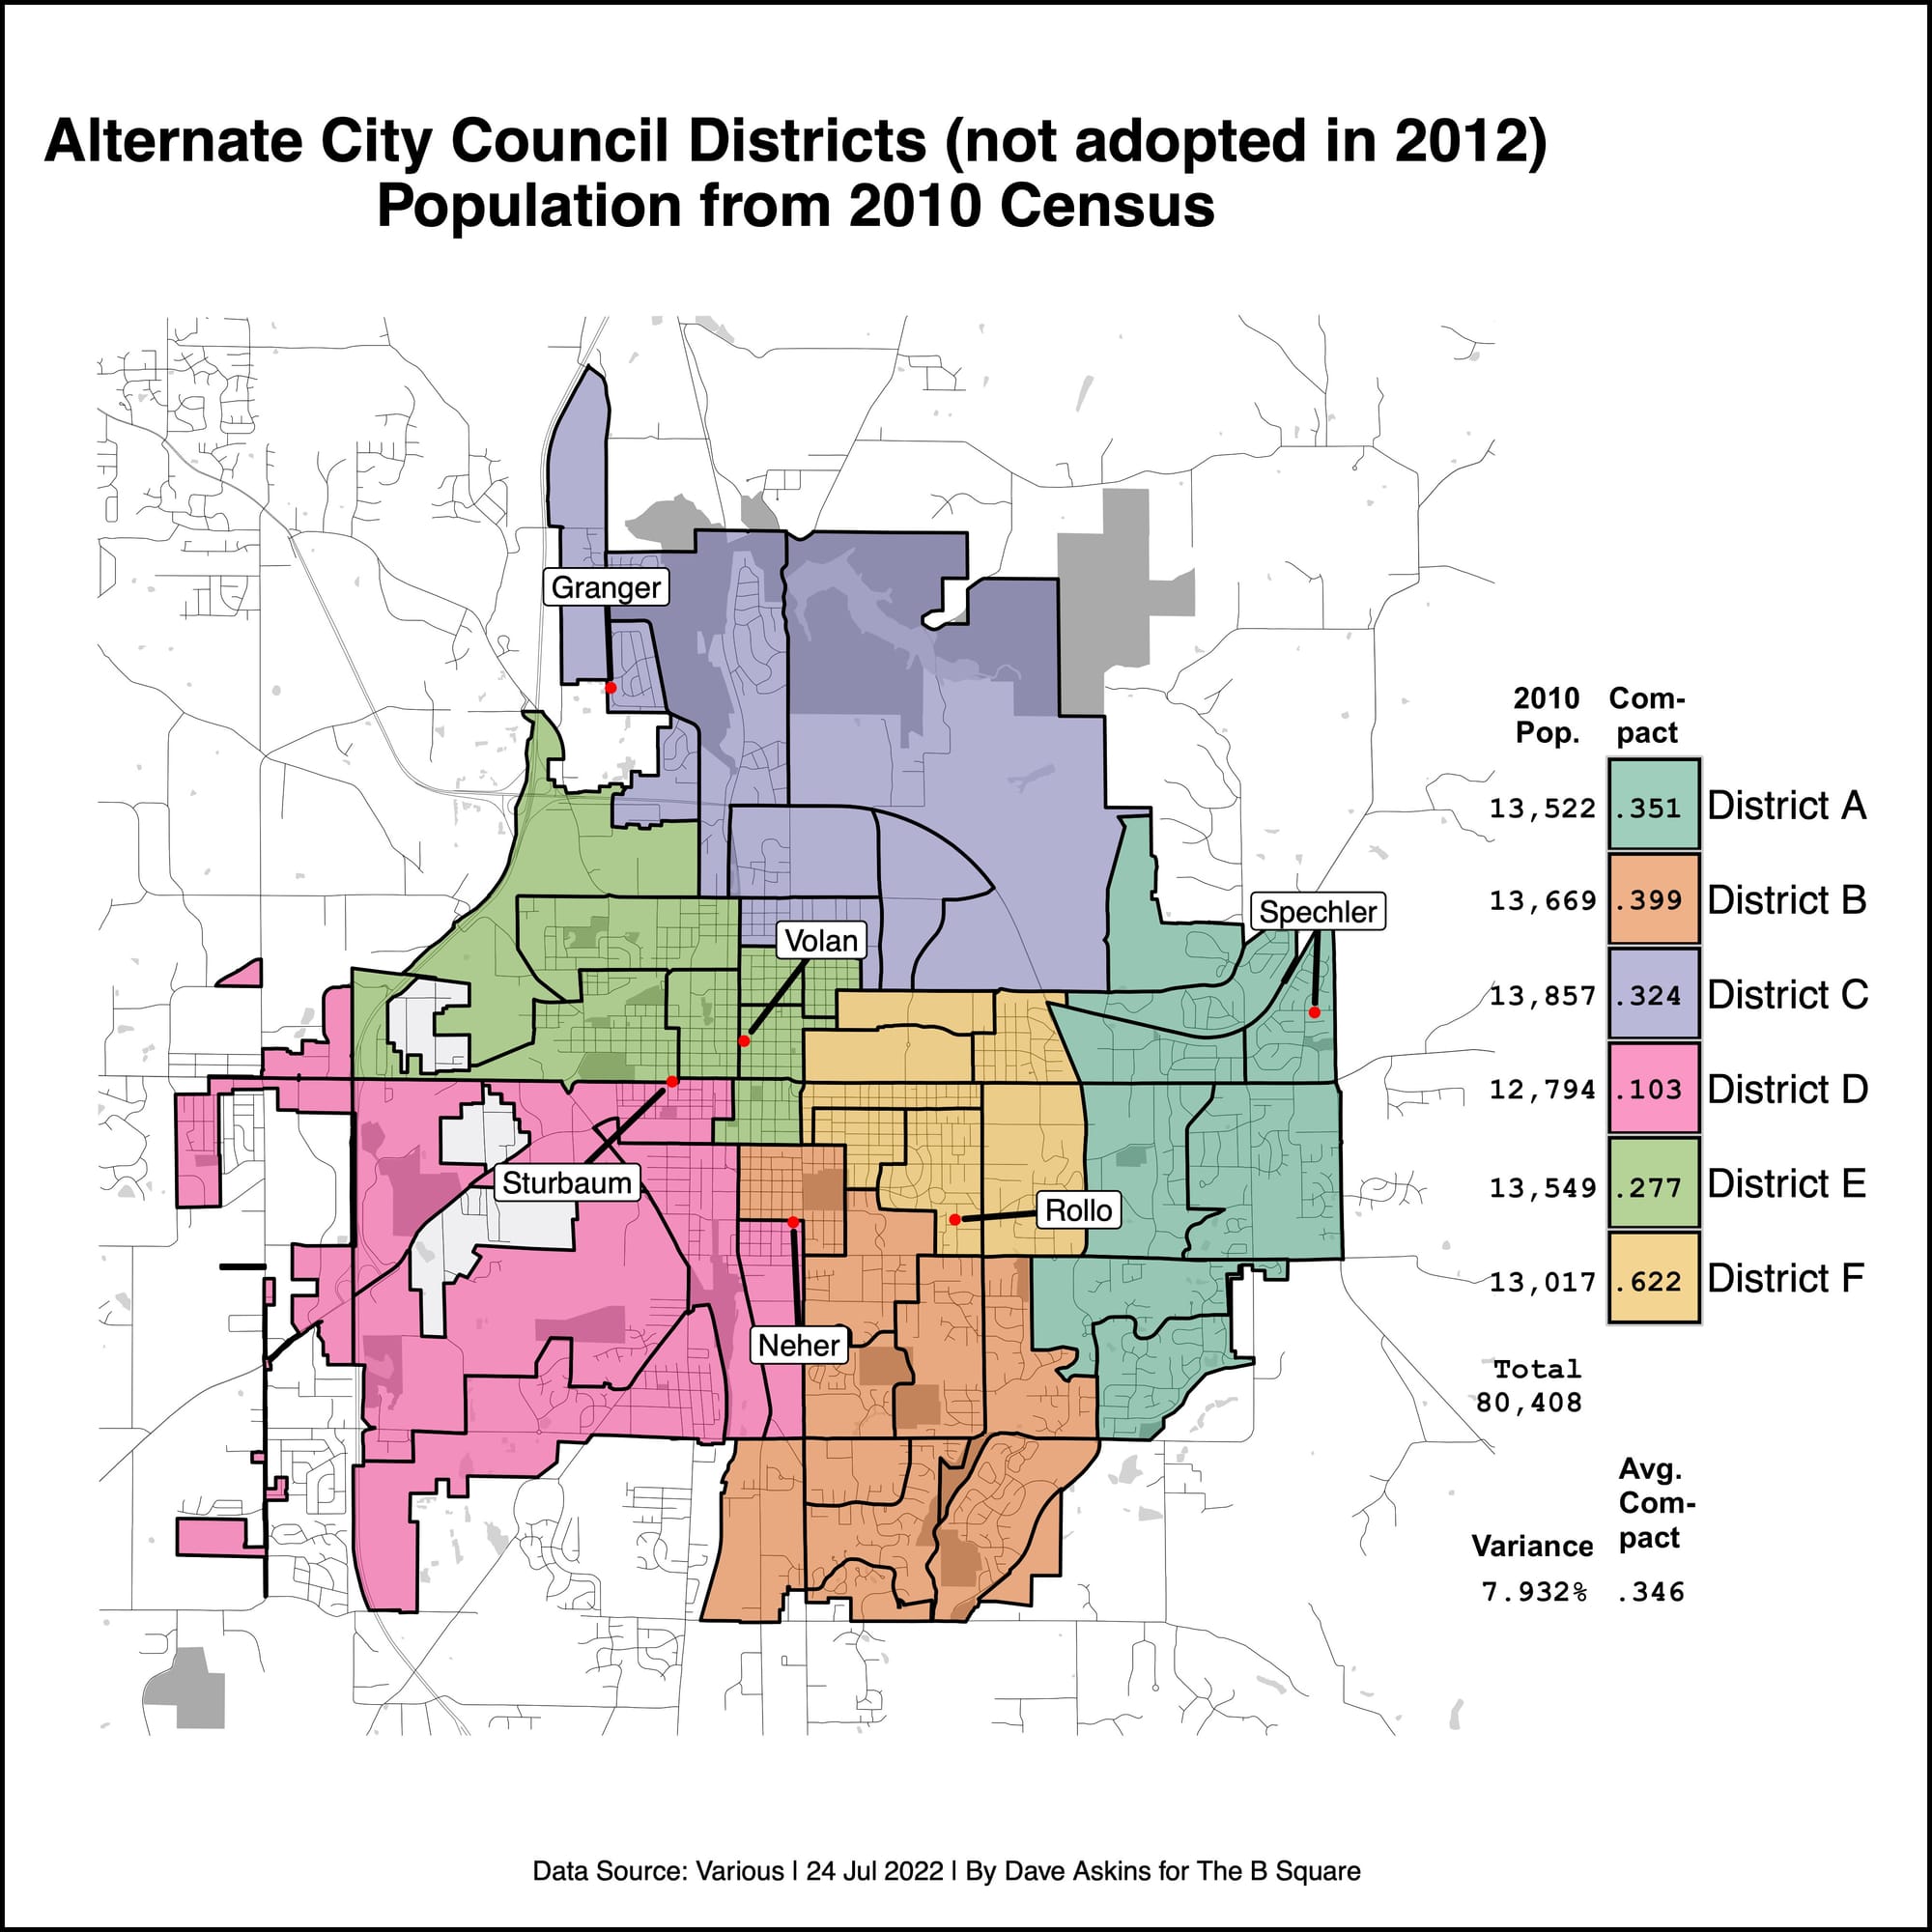
To get an idea of the kind of map that could have been considered in 2012, based on the 2010 census numbers, The B Square used some open source software called Auto-Redistrict to generate an alternative council district map.
Included at the top of this piece is a map that Auto-Redistrict settled on, after evaluating 10s of thousands of alternatives, trying to draw districts that were as population-balanced (based on 2010 census) and as compact as possible.
That map scores better (lower) on population variance than the adopted map: 7.932 percent compared to 8.66 percent.
Based on The B Square’s analysis, the alternative map also scores better on compactness. The average compactness of a district in the alternative map is 0.346. That’s better than the average compactness of a district in the map the council adopted, which is 0.208.
Another difference in the two maps is the impact on the 2012 incumbents. The map that was adopted left each of the six district incumbents in a district of their own, with no other incumbent.
The alternative map would have put Chris Sturbaum and Steve Volan in the same district for the 2015 elections.
Monday’s meeting of Bloomington’s redistricting advisory commission is scheduled to start at 7:30 p.m in the McCloskey Room at city hall.


Comments ()