
Bloomington’s latest survey finds high quality-of-life ratings, big concern about housing
Bloomington’s 2026 community survey found general satisfaction with quality of life, but a lot of concern about affordable housing, homelessness, streets and sidewalks, and the local economy. City councilmembers will receive a presentation at their Wednesday meeting.
Bloomington residents mostly like living here, but they name housing costs, deteriorating streets and sidewalks, the prevalence of homelessness, and the local economy as common complaints.
That is the picture that could emerge in more detail on Wednesday (Aug. 5), when the city council gets a presentation from mayor Kerry Thomson’s administration on the results of Bloomington’s 2026 community survey.
The city paid aQity Research & Insights Inc. $37,900 to do the survey work. The data was collected from what is described as a statistically valid sample that included 561 Bloomington residents. They were surveyed from Feb. 18 through April 10. Of those, 520 responded online and 41 returned paper questionnaires. No one chose to respond by phone.
The results were weighted to square up proportionally with data from the US Census on gender, age, race and ethnicity, whether respondents rent or own their housing, and the presence of children in the household. The consultant says the full sample has a maximum error of plus or minus 4.1 percentage points. A separate open-participation survey was conducted later, but those responses are not mixed with the random-sample results.
Indiana University students were not excluded from responding to the survey, but the report says that their responses were given less weight: “These [census weighting] targets were adjusted to focus more on permanent Bloomington residents, and slightly less on students at Indiana University.”
The survey results reflect a generally favorable assessment of Bloomington as a place to live. About 80% of respondents said they were satisfied with the city’s overall quality of life, compared with 11% who were dissatisfied. About 72% said they would be at least somewhat likely to recommend Bloomington as a place to live, while 18% said they would be unlikely to do so.
Respondents were also generally satisfied with Bloomington as a place for entertainment and recreation.
About 67% percent viewed Bloomington favorably as a place to raise a family, and 57% were satisfied with it as a place to work. Assessments were more mixed for retiring in Bloomington (52% satisfied) and for starting or growing a business (33% satisfied).
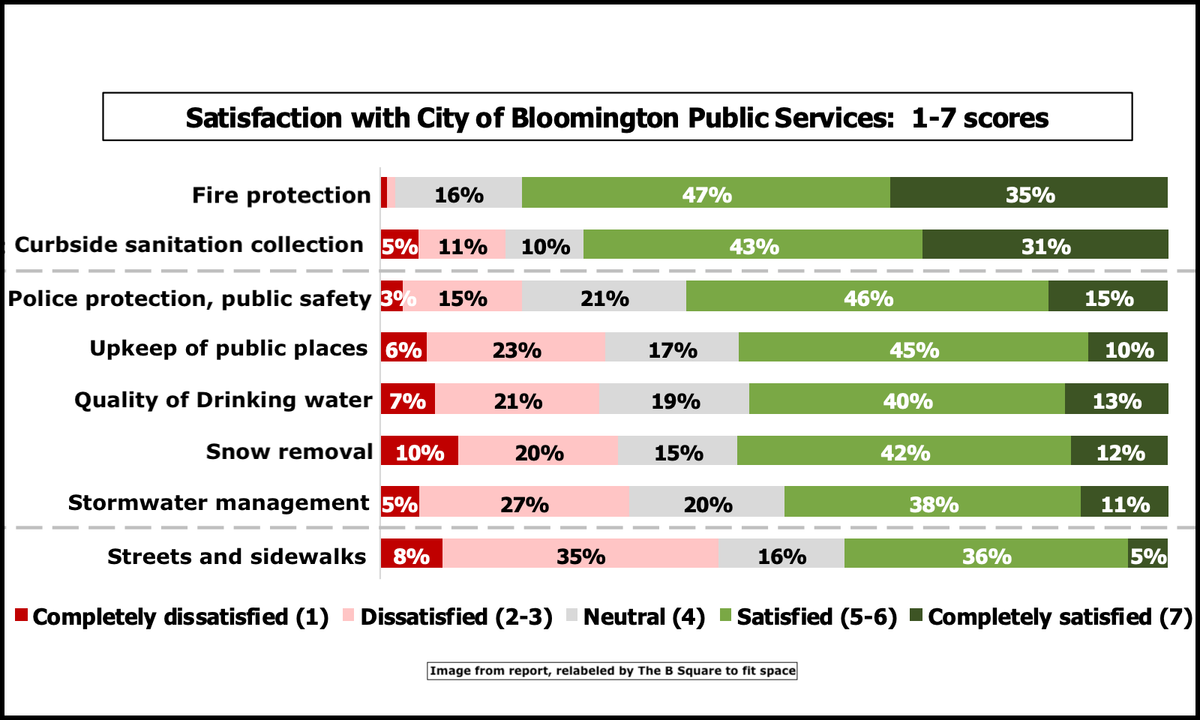
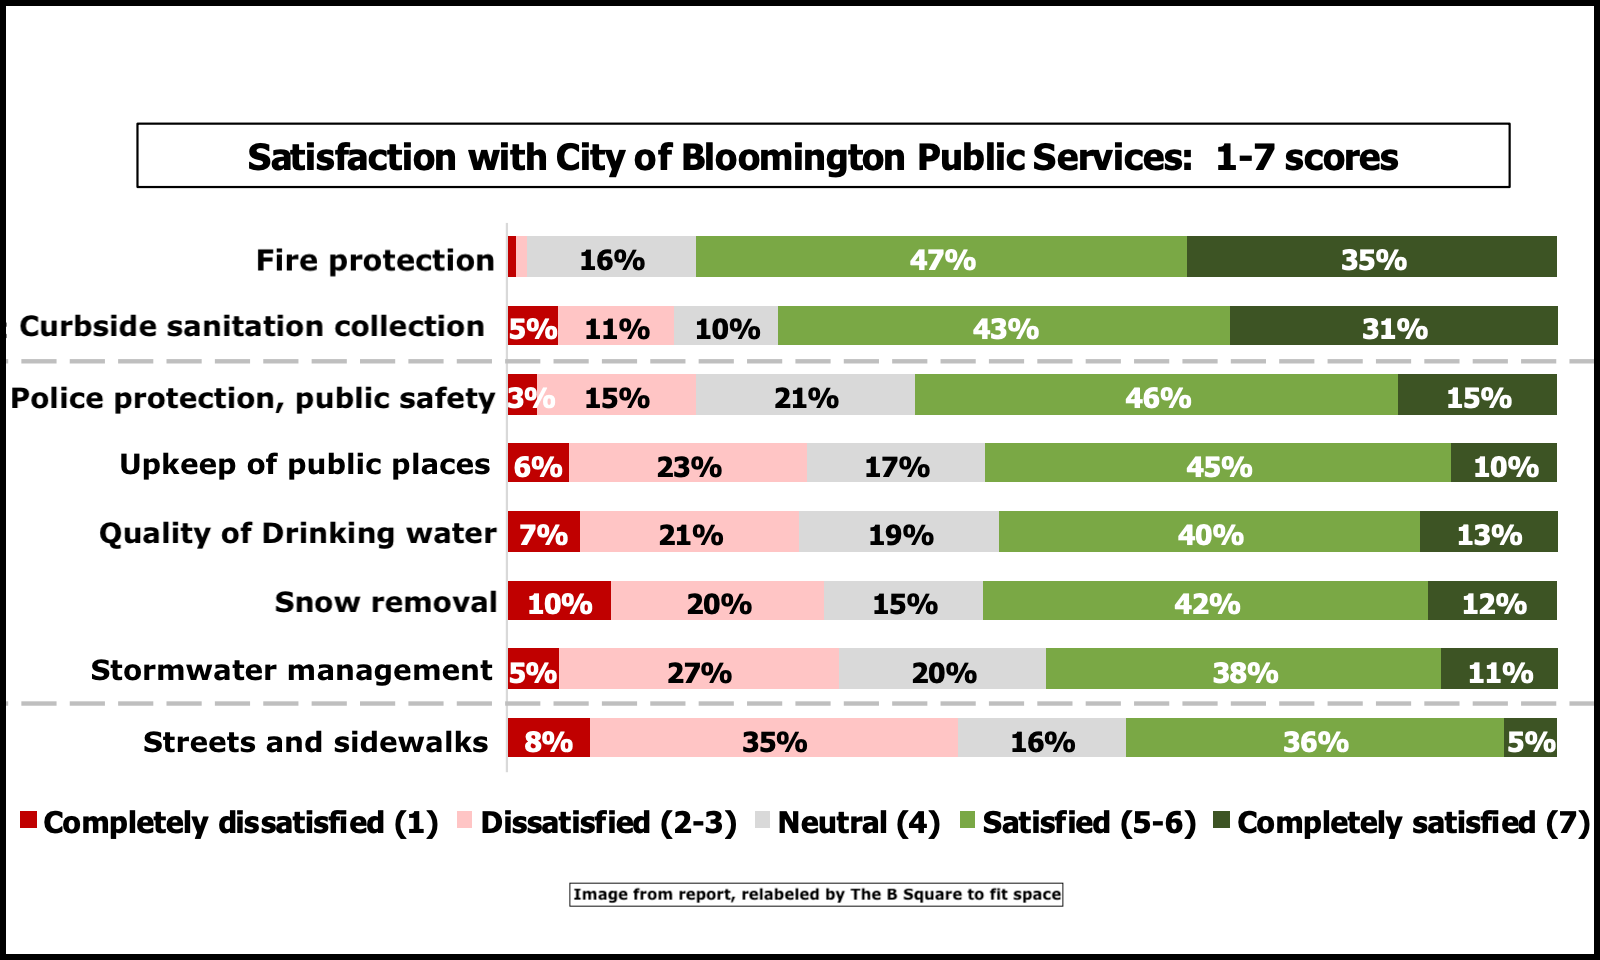
Among city services, fire protection received the strongest rating, with about 82% satisfied. Garbage collection services were rated favorably by 74%. About 61% were satisfied with police protection and public safety.
Just 53% of respondents were satisfied with the city’s water quality, with 28% dissatisfied.
The condition of streets and sidewalks was another weak point: 43% were dissatisfied and 41% satisfied. Respondents frequently mentioned potholes, deteriorating sidewalks and places without sidewalks.
The survey’s most sharply critical result involved housing. About 76% were dissatisfied with the availability of affordable housing, while just 9% were satisfied.
In response to an open-ended question about improvements needed in Bloomington, 19% mentioned the number of unhoused people. That was the second-most common individual response, behind the lack of affordable housing at 32%.
About half of respondents reported some contact with city staff, attendance at a government meeting or participation in a public-feedback process during the past year. Among that group, 69% reported a positive overall impression of their interaction.
Among respondents who had not recently attended a city-led public feedback or comment event, 53% cited scheduling or lack of time and 50% cited lack of awareness. The next most common response, selected by 39%, was a belief that their input would not make a difference.
Questions
Some questions raised by the report include:
- The 2026 survey is described as a new “baseline.” After the administration decided to change vendors, why wasn’t there a core set of questions that remained identical to the questions asked in 2017, 2019, 2021 and 2023, so that trends across time could be measured?
- There are a handful of places where the report tries to compare 2026 results to 2023 survey items. Is the city willing to provide a table that compares those items that are truly comparable across survey years, showing the exact wording, response scale, survey mode, sampling method and weighting method for each year?
- Why does the report cite 2023 findings about feeling safe downtown during the day and at night when those questions apparently were not repeated in 2026? Surely “personal safety overall” is not an apples-to-apples substitute for daytime and nighttime downtown safety?
- How many unique Bloomington residents or households were invited to participate? Based on that figure, what was the response rate?
- What exactly was the sampling frame supplied by the third-party database? Did it include all residential addresses, registered voters, commercially matched residents, utility customers or some other population? How did the sampling frame ensure adequate coverage of renters, people with email addresses, and residents of group quarters like those in university housing?
- If a postcard or questionnaire was sent to an address, could whichever adult was most interested complete it? If so, did the survey methodology try to control for within-household selection bias?
- What languages other than English were offered? What accommodations were available for residents with disabilities or limited internet access?
- The percentages reported for the open-participation survey seem like they are actual unweighted percentages. Is that correct? If so, is the administration concerned about the fact that the actual percentage of Black respondents for the open participation survey is 2% compared to the 6% for weighted data?
- What are the unweighted percentages for demographic profile data? Otherwise put, what are the actual Ns to which weights were applied for the tables showing a breakdown for demographics (race, gender, Hispanic/non-Hispanic, children in household, own versus rent, and age)?
- A proportional citywide sample was almost guaranteed to produce too few Black respondents for reliable conclusions about Bloomington’s Black population. Why were Black residents not oversampled?
- What precisely does this mean: “These [census weighting] targets were adjusted to focus more on permanent Bloomington residents, and slightly less on students at Indiana University.” What was the weighting formula that was actually used? How much less is “slightly less”?
- Did the City’s request for proposals from vendors to conduct the survey identify the ability to analyze minority residents as an objective? If so, why was the sample designed only to reproduce minority population share, rather than to provide enough cases for analysis?
- “Personal safety overall” collapses very different policy problems into one number. Why did the survey not distinguish among: fear of violent crime, traffic danger, harassment, racial hostility, hate crimes, encounters with police, and concern about unhoused people?
- Is the administration willing to release an anonymized respondent-level dataset, the full questionnaire, weighting specifications, and a standard set of crosstabs?

Comments ()